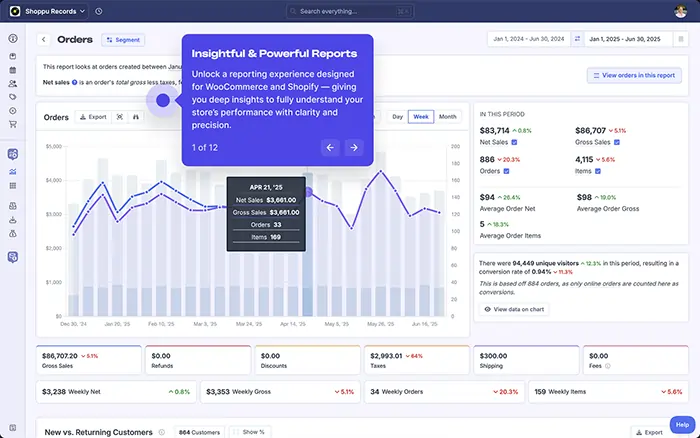
Shopify Reports that provide clarity, not confusion.
Track your true net profit, discover top customer cohorts, and get clear on customer acquisition costs and lifetime value - all in one intuitive, real-time interface.
- 75+ Reports
- Net Profit
- Email Digests
- Multi-Store


How it Works
From install to your first report in under 5 minutes. No developer needed.
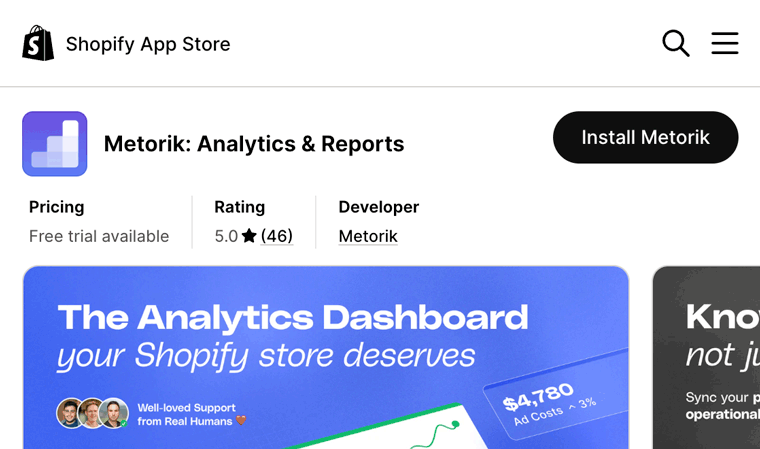
1. Connect your Store
Install the Metorik app from the Shopify App Store. In 5 minutes and a few clicks, you'll be connected – zero technical knowledge required.
2. Get 75+ Reports
Metorik imports your full order history and builds out 75+ reports – sales, customer, product, profit and cohort. All real-time. Zero load on your store.
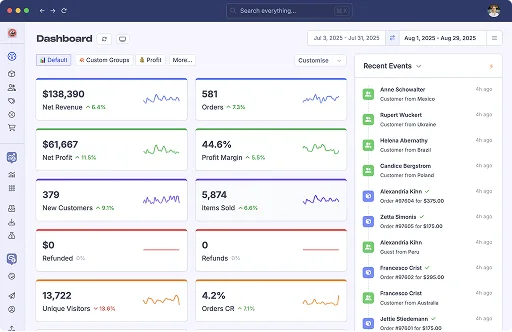
3. Get Clarity with Metorik
Know which products drive growth (and how much), which customer cohorts stay, and which advertising channels are actually profitable.
75+ Pre-built Reports. Endlessly Filterable.
Whatever questions you have about your store, you'll find a report for it in Metorik.
Net/gross revenue over time
RevenueNet/gross sales over your selected time period, plotted on a chart.
Revenue grouped by location or payment
RevenueRevenue grouped by billing/shipping location or payment method.
Revenue grouped by tax
RevenueRevenue grouped by tax code, label, or ID.
Net profit & costs over time
ProfitNet profit (after COGS, shipping, ad spend & fees) and gross profit, plotted on a chart.
Advertising costs
ProfitAd costs grouped by platform (ChatGPT Ads, Facebook, Google Ads, Snapchat, Reddit, etc.) over time.
Operational costs
ProfitOperational costs grouped by type, over time.
Transaction costs
ProfitTransaction costs grouped by payment method.
Shipping costs
ProfitShipping costs grouped by shipping method.
Sales forecast
ForecastExpected gross sales over the next 12 months.
Order volume forecast
ForecastExpected order volume over the next 3, 6, 12 months based on your historical data.
New customers forecast
ForecastExpected new customers over the next 3, 6, 12 months based on your historical data.
Orders over time
OrdersOrder data from your selected time period plotted on a chart.
New vs. returning customer orders
OrdersCustomers, orders and sales split into new and returning groups.
Item count distribution
OrdersHow many items customers are adding to their orders.
Order value distribution
OrdersHow much customers are spending on their orders.
Orders by day of week
OrdersGross sales broken down by day of the week.
Orders by hour of day
OrdersGross sales broken down by hour of the day.
Orders heatmap (day & hour)
OrdersHeatmap of orders and gross sales by day and hour.
Average order gross over time
OrdersAverage order gross plotted over time.
Average order item count
OrdersAverage items per order plotted over time.
Order created → completed time
OrdersAverage time between an order being created and fulfilled.
Orders grouped by status
Order GroupsOrders & sales by status, including excluded statuses.
Orders grouped by payment method
Order GroupsOrders & sales grouped by the payment method used.
Orders grouped by shipping method
Order GroupsOrders & sales grouped by the shipping method used.
Orders grouped by currency
Order GroupsOrders & sales grouped by currency.
Orders grouped by location
Order GroupsOrders & sales by billing/shipping country, state, city, ZIP.
Orders grouped by metafield or tag
Order GroupsOrders & sales grouped by a chosen metafield or order tag.
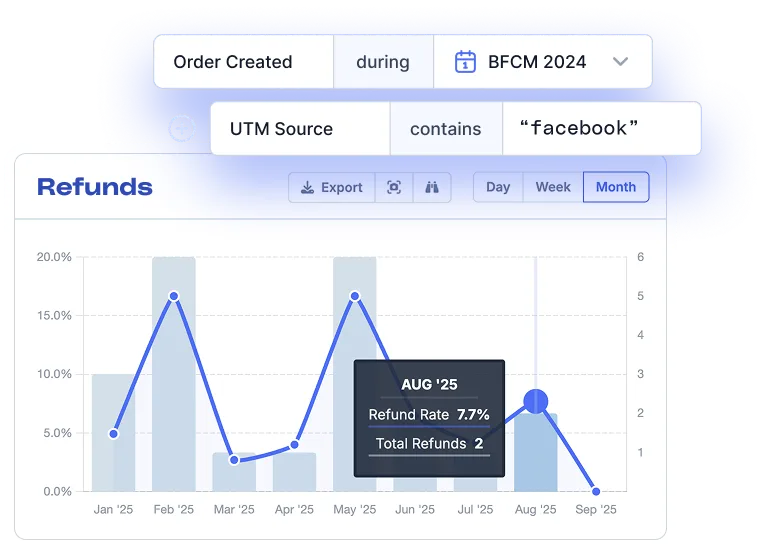
Refunds over time
RefundsRefunds over your selected time period.
Time between order & refund
RefundsAverage time between an order being placed and refunded.
Most refunded products
RefundsMost refunded products and their refund stats over time.
Refunds grouped by reason
RefundsRefunds and average refund amount by reason.
Refunds by billing location
RefundsRefunds and average amount by billing country, state, city, ZIP.
Refunds by shipping location
RefundsRefunds and average amount by shipping country, state, city, ZIP.
Order sources by referring site
SourcesOrders, gross sales, and AOV for each referring site.
Order sources by landing path
SourcesOrders, gross sales, and AOV for each landing path.
Order sources by UTM parameters
SourcesOrders, gross sales, and AOV for each UTM combination.
Customer LTV by acquisition source
SourcesCustomers, average orders, and lifetime value per referring site or channel.
Customer sources by landing path
SourcesCustomers, average orders, and average LTV per landing path.
Customer sources by UTM parameters
SourcesCustomers, average orders, and average LTV per UTM combination.
Coupon usage & sales generated
CouponsTotal usage, amount discounted, and sales generated per coupon.
New customers over time
CustomersNew customers over time, plotted on a chart.
Customers by first ordered month
CustomersNew customers grouped by their first ordered month.
Customers heatmap
CustomersCustomers plotted on a map of the world.
Customers grouped by first product
Customer GroupsNew customer cohorts grouped by their first ordered product.
Customers by billing location
Customer GroupsNew customers, LTV & more by billing country, state, city, ZIP.
Customers by shipping location
Customer GroupsNew customers, LTV & more by shipping country, state, city, ZIP.
Customers grouped by metafield or tag
Customer GroupsNew customers, LTV & more grouped by a chosen metafield or customer tag.
Orders made over customer lifetime
RetentionHow many orders your customers make over their lifetime.
New vs. returning customer KPIs
RetentionCompare customers, orders, gross spend and AOV between groups.
Time between repeat orders
RetentionHow long existing customers wait between subsequent orders.
Items bought over customer lifetime
RetentionHow many items a customer purchases over their lifetime.
Cohort: Returning customers
CohortCustomers that returned to make another order each following month.
Cohort: Customers by order count
CohortCustomers grouped by their total order count, per cohort.
Cohort: Orders per customer
CohortAverage orders per customer in each month after they joined.
Cohort: Average order value
CohortAOV of orders made by a cohort each month after they joined.
Cohort: Average order profit
CohortAverage order profit per cohort each month after they joined.
Cohort: Customer lifetime value
CohortCumulative average LTV per cohort each month after they joined.
Cohort: Customer lifetime profit
CohortCumulative average lifetime profit per cohort.
Cohort: Sales over time
CohortTotal sales per cohort each month after they joined.
Cohort: Orders over time
CohortNumber of orders per cohort each month after they joined.
Cohort: Profit over time
CohortTotal profit per cohort each month after they joined.
Products frequently bought together
Product SalesMost commonly co-purchased products in the same order.
Top selling products
Product SalesBest-selling products by units, revenue, or profit.
Top selling variations
Product SalesBest-selling product variations.
Top selling categories
Product SalesBest-selling product categories.
Product groups
Product SalesCustom groups of products/variations and their combined sales.
Product stock velocity
Product SalesDaily sales per product and expected days of stock left.
Variation stock velocity
Product SalesDaily sales per variation and expected days of stock left.
Product vendors
Product SalesProduct sales broken down by vendor or brand.
Product comparison
ComparisonCompare as many products as you like, plotted on a chart.
Category comparison
ComparisonCompare as many categories as you like, plotted on a chart.
Orders by device
DevicesOrders & sales for desktop vs. mobile.
Orders by operating system
DevicesOrders & sales for each OS (iOS, Windows, etc.).
Orders by web browser
DevicesOrders & sales for each browser (Chrome, Safari, etc.).
Carts started by date
CartsNew carts started over your selected time period.
Carts abandoned by date
CartsCarts abandoned over your selected time period.
Carts placed by date
CartsCarts that placed an order over your selected time period.
Carts recovered by date
CartsCarts recovered after abandonment over time.
Time between cart & order
CartsHow long carts take to become orders, by hours or days.
Carts grouped by billing country
CartsCarts started, placed, abandoned, and recovered by country.
Cart product reports
CartsMost-added, abandoned, placed, and recovered cart products.
Advanced Shopify reports, sliced any way you want.
Shopify's 2025 update finally lets you ask AI for reports – but only the reports Shopify already has, and only the data it has. Metorik helps you bring in ALL your costs to get a complete view of your true profit, whilst letting you slice and dice it with over 500 filters. No spreadsheets. No SQL. No waiting.
Any Report
Take any of the 75+ pre-built reports covering Sales & Revenue, Costs & Profit, Orders, Refunds, Discounts, Customers, Cohorts, Products, Carts, Acquisition and more.
Any Segment
Apply any of the 500+ filters across orders, customers, products, carts and discounts, including your own "additional info" and tags. Combine with AND / OR logic, and filter groups.
Any Question, Answered.
Get answers to your most burning questions: "What's my profit per product for repeat customers from Google Ads?" or "Is my refund rate for fragile items shipped to California higher than other states?" The options are endless.

Your Shopify store deserves better reports
Join the 10,000+ stores that upgraded from spreadsheets and basic apps to real-time, instantly filterable reporting for their Shopify stores. Free for 30 Days.
✅ 30-Days Free. 💳 No Credit Card required.
How Metorik Compares to other Shopify reporting apps
Shopify's 2025 analytics update added customizable dashboards… but it still can't show your net profit, your customer cohorts, or your true LTV by channel. Many stores were previously spending $500+ per month across multiple apps just to get the insights they needed. Metorik gives you all of it – in one place, with clear pricing.
Feature-by-feature breakdown
| Feature |
|
|
Other Apps |
|---|---|---|---|
| Reports Coverage | |||
| Pre-Built Reports | 75+ | ~6 | Varies |
| Profit Reports (COGS, Margins, ROAS) | Separate app | ||
| True Net Profit (after Ad Spend, Fees, etc) | Less COGS only | Some | |
| Cohort Reports | |||
| Sales Reports (Revenue, Orders, Refunds) | Basic | Varies | |
| Customer Reports (LTV, Churn, Retention) | Limited | ||
| Product Reports (Top Sellers, Profit by SKU) | Basic | Varies | |
| Scheduled Email Digests | Separate app | ||
| Data & Performance | |||
| Reporting Delay | Up to 2-min delay | Up to 24h delay | Varies |
| Flat Pricing | Order-based | Plan-tier | GMV-based |
| Multi-Store Reporting | |||
| Core Web Vitals | Unaffected | Unaffected | Varies |
| Claude & ChatGPT MCP Integration | All Sales and Store Data | Store management only | Varies |
| Exports (CSV, Webhooks, API) | Basic CSV or API | Varies | |
| Beyond Reports | |||
| Email Automations & Flows | Separate app | ||
| Abandoned Cart Recovery Emails | Basic | Separate subscription | |
| Works on Shopify + WooCommerce | Shopify only | Varies | |
Unlimited Users Simple Pricing
All Reports
Our pricing scales based on your average monthly orders. Better yet, one subscription covers ALL your stores.
- All Reports & Analytics
- Includes Emails Need More?
- Unlimited Contacts
- Connect Multiple Stores
- Connect up to Stores

⭐⭐⭐⭐⭐
Metorik is my FAVORITE app - marketing, sales, and customer service information all in one place.
I'm able to quickly pull reports, make business decisions, troubleshoot customer issues, etc. It's a must-have for me and my team.


The Reporting App built for growing stores
Shopify was built to help you sell, not report.
Metorik replaces basic, fragmented Shopify reports with a single reporting tool that answers your hardest questions in seconds. Profit margins, customer LTV, ad spend ROI – all without touching a spreadsheet or SQL query.
Easy to use, custom reports, and all the data that you would need in a clear and easy format. Thank you for the great app and making life easy.Alta Murad , Founder at Maya's Closet 🇺🇸
❤️
Exceptionally well-loved support from real humans,
not chat bots.
Our support doesn't end at signup – that's where it really begins..
Everyone on the Metorik team helps out with support, so the person you're chatting with has in-depth product knowledge and our finger on the pulse with feedback.
We're invested in seeing your store succeed, and we're here to do what we can.
What stood out to me was the partnership. Metorik didn't just point me to documentation - you took the time to understand our business and support us personally.
…also, their support is great as they always respond very fast and take time for our needs.
On top of this the analysis tools are excellent and the customer support is seriously second to none.
Their team is amazing, support is fast, UI is NEARLY perfect, the founder is involved and takes feature requests seriously and quickly if the use-case is clear.
Their team is amazing, support is fast, UI is NEARLY perfect, the founder is involved and takes feature requests seriously and quickly if the use-case is clear.
I've made feature suggestions, and twenty minutes later they’ve told me told me to refresh my screen, and BOOM! It's already there. Incredible!
The speed with which Bryce and his team provide support, fix bugs and deploy features is beyond incredible.
Metorik is one of the very best. It's extremely intuitive, fast, and customizable. The support team is very responsive, as well. I would recommend this to all of my clients.
App support is the best I’ve seen … always responsive and has helped us with every single thing we’ve asked for.
In about 2 clicks, Metorik has given my CRM the UI of Stripe, the data analytics of Tableau, and the customer service of the Ritz-Carlton. I can't recommend them enough.
exceptional attention to my employees whenever we have a problem or inquiry. The response time is truly remarkable
In about 2 clicks, Metorik has given my CRM the UI of Stripe, the data analytics of Tableau, and the customer service of the Ritz-Carlton. I can't recommend them enough.
Metorik remains our trusted compass, providing the insights we need to steer confidently. A sincere thank you to the Metorik team for their unwavering support.
Best yet, the team at Metorik are super supportive - what more can a business ask for?
“…also, their support is great as they always respond very fast and take time for our needs.”
Shopify Reports FAQs
Can't find what you're looking for below? Read our Help Docs
How many reports does Metorik provide for Shopify?
Metorik includes 75+ pre-built reports across sales, orders, discounts, refunds, customers, products, costs, profit, cohorts, and more. Plus, all Metorik's reports can be instantly filtered by almost any data-point on your store.
Can I build my own custom Shopify reports?
Yes. Choose a starting report and then filter, group, segment, and combine criteria like country, tag, customer LTV, channel, refund status — almost anything. Save your custom segments and share them with your team. No SQL, no spreadsheets.
How long does it take to set up Metorik with Shopify?
Under 5 minutes. Install the Metorik app from the Shopify App Store, approve the connection, and Metorik imports your full order history automatically. Your reports are ready by the time you finish your coffee.
Does Metorik replace Shopify's built-in reports?
Most stores keep both for the first day or two, but quickly stop opening the built-in reports altogether. Metorik's reports are much faster to load, reflect real-time data, are more accurate, more flexible, and aren't locked behind Shopify Plus.
Does Metorik show net profit, or just gross?
Net. Most Shopify reporting tools — including Shopify's built-in reports — stop at gross profit (revenue minus product cost). Metorik calculates real net profit by subtracting COGS, shipping, transaction fees, payment fees, refunds, and your ad spend across ChatGPT Ads, Google, Meta, TikTok, Snapchat, and Reddit. Most stores miscalculate profit by 20–35%. Metorik fixes that.
How does Metorik compare to Lifetimely, TrueProfit, or Better Reports?
Metorik consolidates what those apps each do separately. Lifetimely focuses on LTV, TrueProfit on profit, Better Reports on custom reports. Metorik gives you all three (plus 70+ more reports, plus email automations and abandoned-cart recovery), with clear pricing that doesn't penalize growth.
Can I export Shopify reports or schedule them by email?
Both. Export any report to CSV in a click. Or schedule any report as an automated email digest — daily, weekly, monthly — to anyone on your team. There's also a full REST API and webhook system for custom workflows.
Do I need a credit card to start my free trial?
No. The 30-day free trial requires no credit card. You get full access to every report and every feature during the trial. You can even send up to 1,000 abandoned cart emails for free.
Still have questions?
Can't find the answer you're looking for? Chat to our friendly team.
Tired of incomplete reports? Get clarity with Metorik.
- 75+ Pre-Built Reports
- Endlessly Filterable
- Scheduled Email Digests
- Real-Time Data
- Net Profit Tracking
- 30-Days Free
Register now and we'll send you a link to finish the setup on your computer. ✅ 30-Days Free. 💳 No Credit Card required.