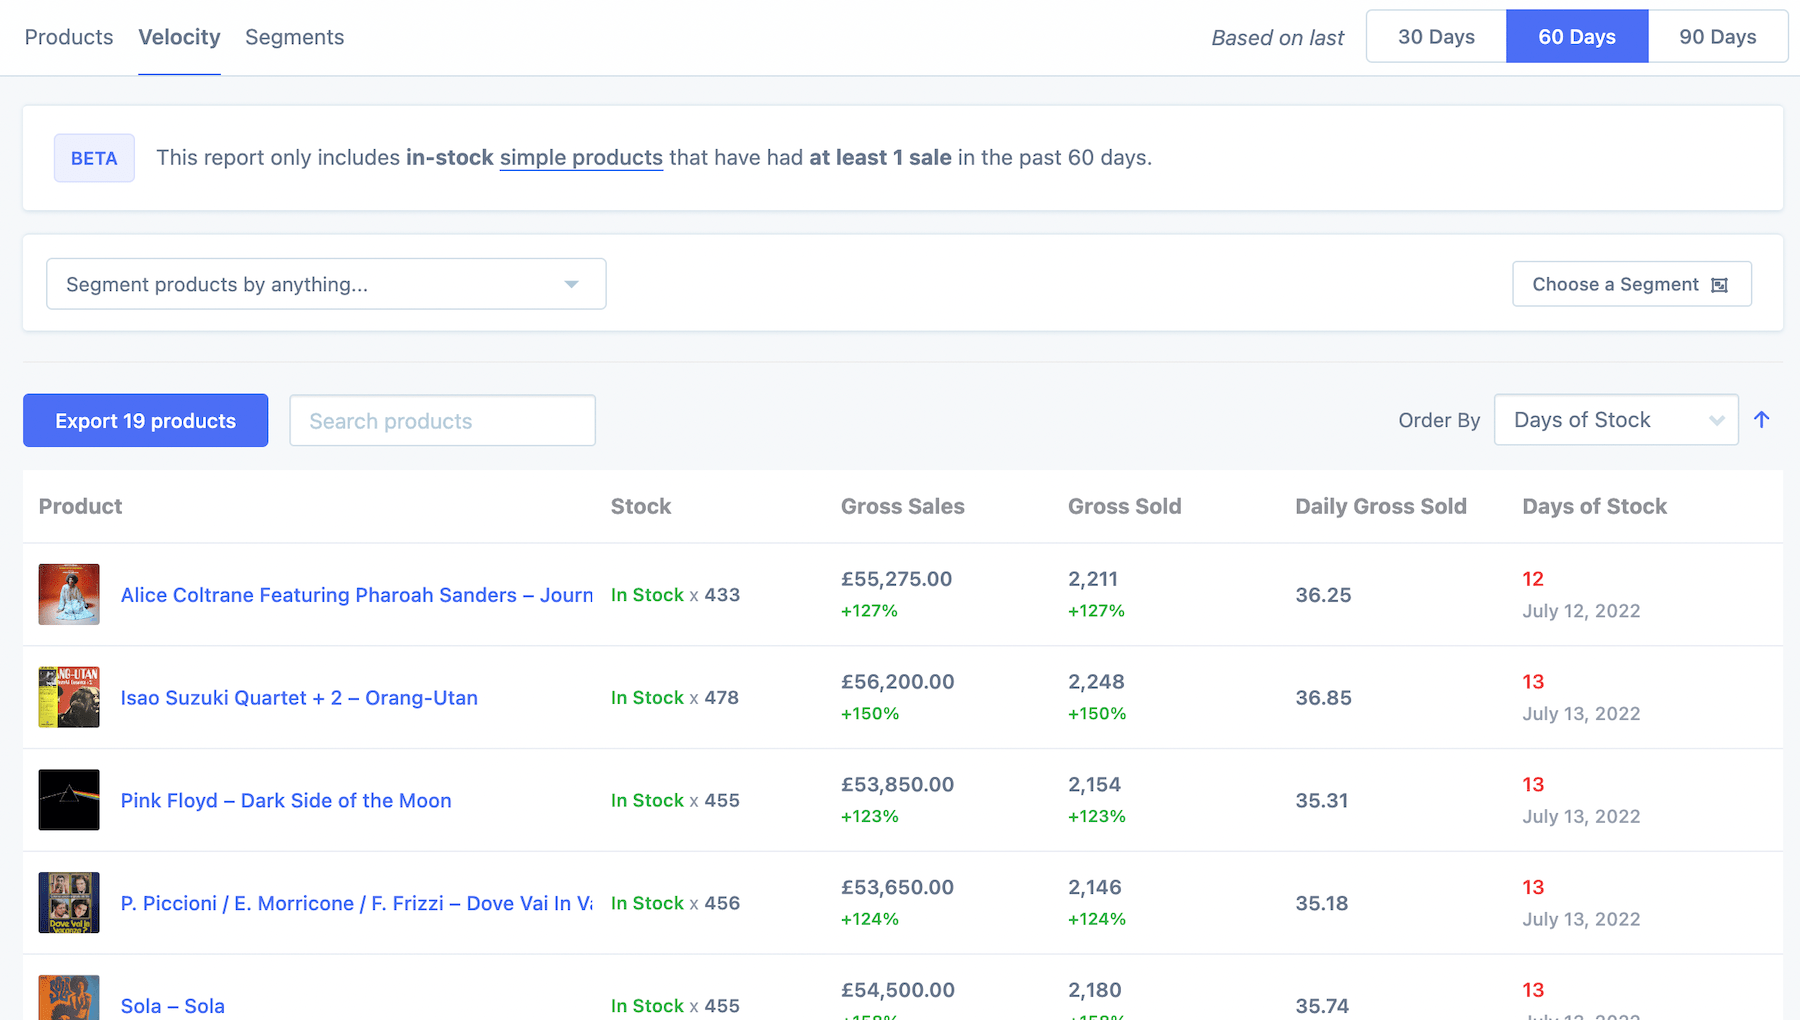
Today we've released a small, but meaningful feature that we wanted to share with you. Product stock velocity reports are our attempt at providing a simple overview of when your products and variations will run out of stock, based on current stock levels and recent sales history.
The idea and implementation is quite simple. You select how many days of sales you want to look at to determine the daily gross sold per product. It could be 30 days, 60 days, or 90 days.

Then we'll look at that and the stock on hand, calculating the estimated days of stock left by using the daily items sold average.
With this information you can make key decisions around when to order additional stock, which products are not performing, and which are exceeding expectations.
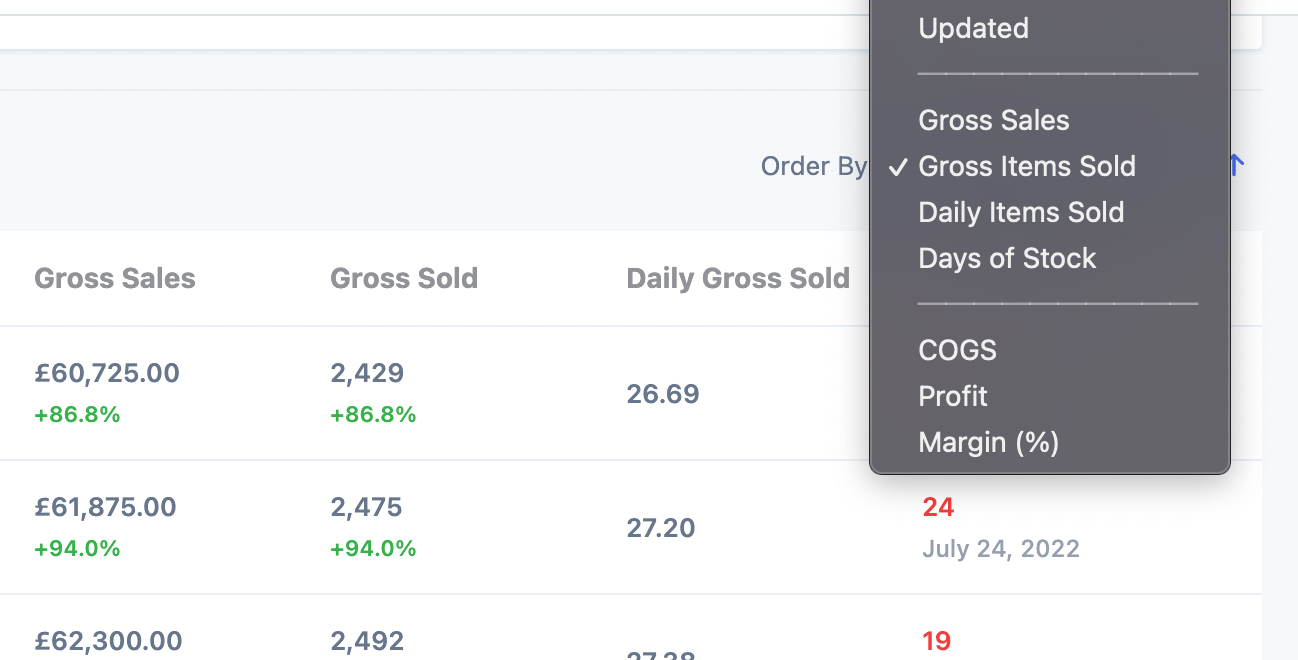
You can change the ordering to be by velocity (daily gross items sold), days of stock, title, SKU, and more.

These stats are now included in product and variation exports under new columns.
As we have separate sections for products and variations, they have their own respective velocity reports too. Existing stores can access the products velocity report here and the variations velocity report here.
We hope you find this new report useful in managing your stock predictions for WooCommerce & Shopify, and planning when to purchase more inventory.


