
As we’ve grown as a company both in numbers of stores leveraging Metorik, and in head count – most recently with the addition of our two newest team members, Joey and Luke (hello 👋) – we’re finally in a position to create a report with a scale of data that ensures that real insights, not anomalies, can be surfaced, investigated, and shared.
As Bryce, Metorik’s founder, expresses in his foreword, data at scale is immensely powerful. By analyzing data from thousands of stores across various industries, this report surfaces valuable benchmarks and insights about the current state of eCommerce and WooCommerce’s role in it.
With the release of the Metorik Insights for WooCommerce report, we aim to shine a light on the incredible success of WooCommerce, and empower WooCommerce store owners with actionable (and sometimes simply interesting) insights to foster future growth and success for the whole WooCommerce community, not just Metorik’s customers.
In this blog post, we dive into a handful of the key insights we personally found most interesting, and explore how they might be leveraged by WooCommerce store owners.
If you like what you see, make sure to head over to get the full report.
Ok, let’s dive in…
General WooCommerce Statistics
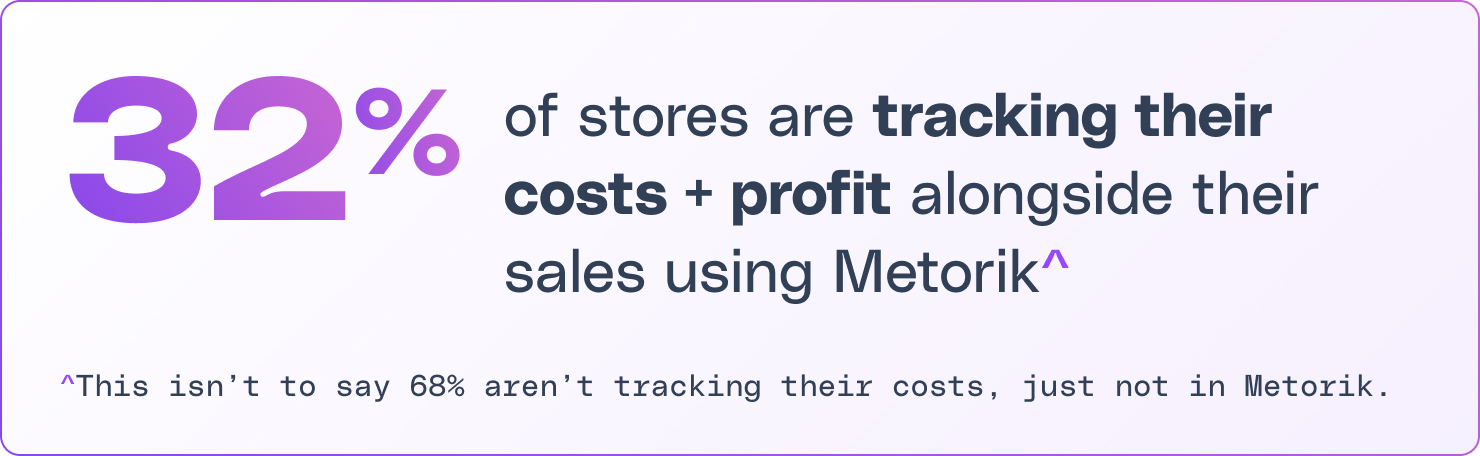
At least 32% of stores are tracking their costs & profit
This was a little higher than we anticipated, given that cost tracking isn’t an inbuilt functionality in WooCommerce like it is in Shopify and other platforms.
For Metorik’s customers using the official WooCommerce COGS Plugin, product costs sync through automatically, but for the rest, they are setting costs in Metorik directly, or syncing costs through custom fields.
Whilst none of these methods are too laborious, it does demonstrate that a large number of store owners understand the importance of cost tracking and are willing to put in the effort to properly identify and add their product, transaction, advertising and other costs.
Other key general WooCommerce stats we discovered
The average WooCommerce store is approximately 4 years old (1,539 days).
28% of WooCommerce stores leverage subscriptions, enhancing customer retention and maximizing CLTV.
18% of WooCommerce stores sell in multiple currencies, emphasizing the platform’s international eCommerce versatility.
WooCommerce Order Insights and Trends
The Average Order Value (AOV) for WooCommerce stores drops by 20% on weekends
As you can see below, looking across over 5,000 stores in different countries and across different industries, there’s a distinct trend of people typically spending around 20% less on Saturday and Sunday than they would otherwise.
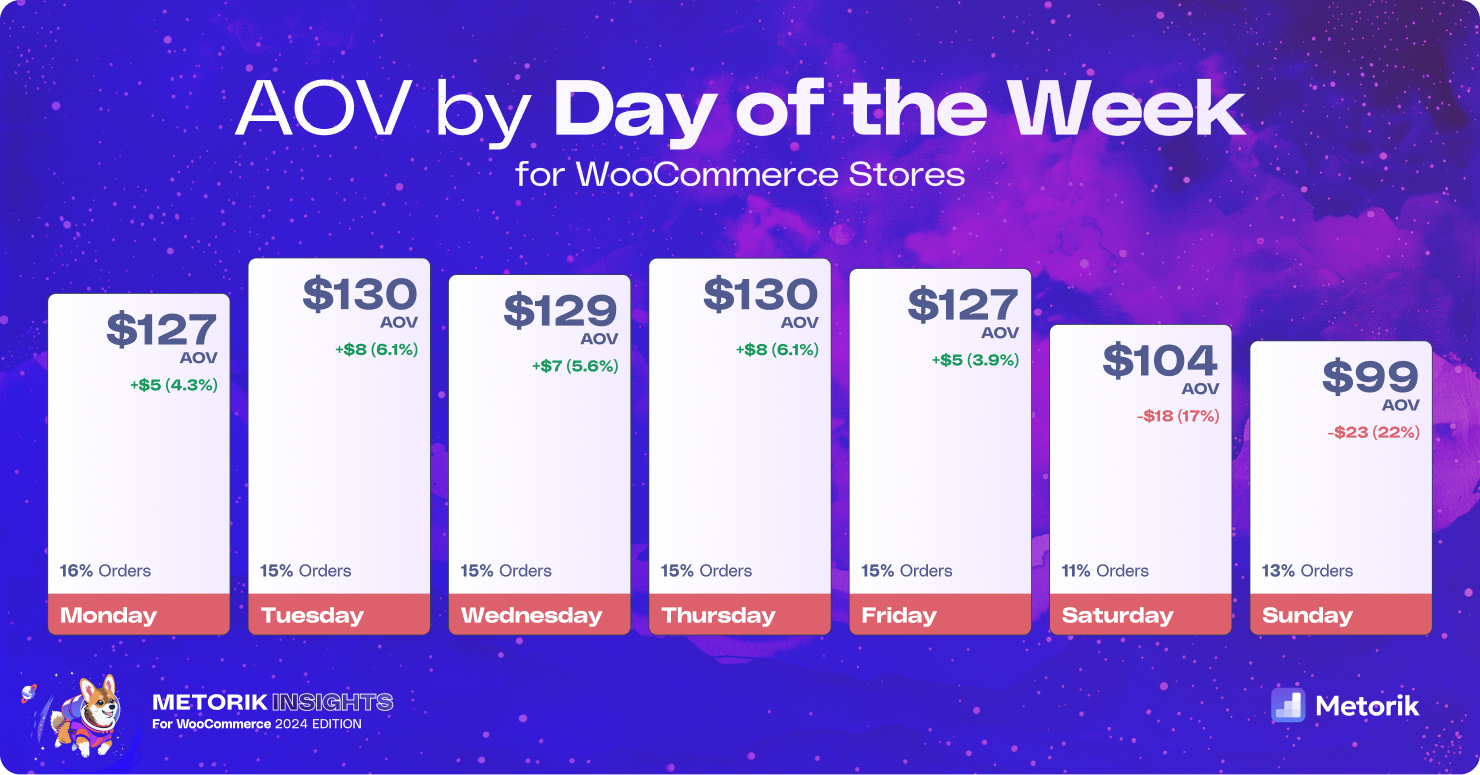
Now it’s important to note that the trends in certain industries (potentially yours) don’t follow this path.
Have an idea of a breakdown you’d like to see for the next report?
Just tweet at @metorikhq and let us know!
Other key WooCommerce Order statistics we discovered:
Refund rates vary significantly by industry with digital products experiencing higher refund amounts (% of order value) compared to physical goods.
It typically takes a WooCommerce store 600 days to 10X their order volume from 1,000 orders to 10,000, to 100,000. Notwithstanding survivorship bias, an impressive 41% of stores make it to 10,000 orders.
WooCommerce End-Customer Insights
More orders are placed on mobile devices, but AOV on average is 78% higher on desktop devices
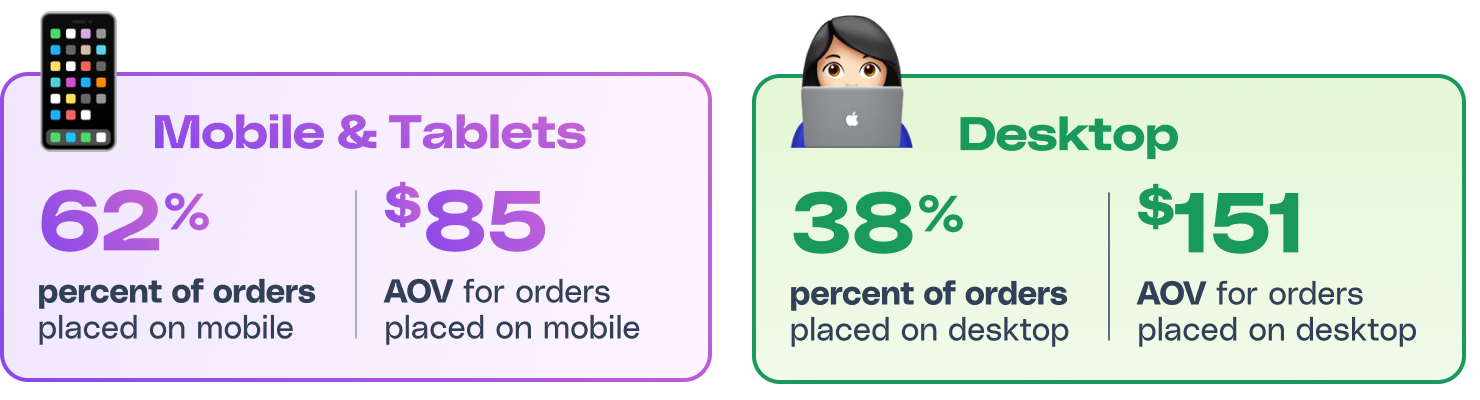
This was quite a big surprise to us. With so much emphasis in recent years (even the last decade) being placed on the mobile shopping experience, it’s easy to overlook the importance of having a great desktop experience for your customers and asking how you can best leverage the additional screen real-estate on offer.
More-so, as Bryce discusses on the recent episode of the Do The Woo Biz podcast, what options there might be to better connect the wonderful browsing experience mobile phones and tablets offer, with the (typically) increased likelihood of customers to spend more when using desktop devices?
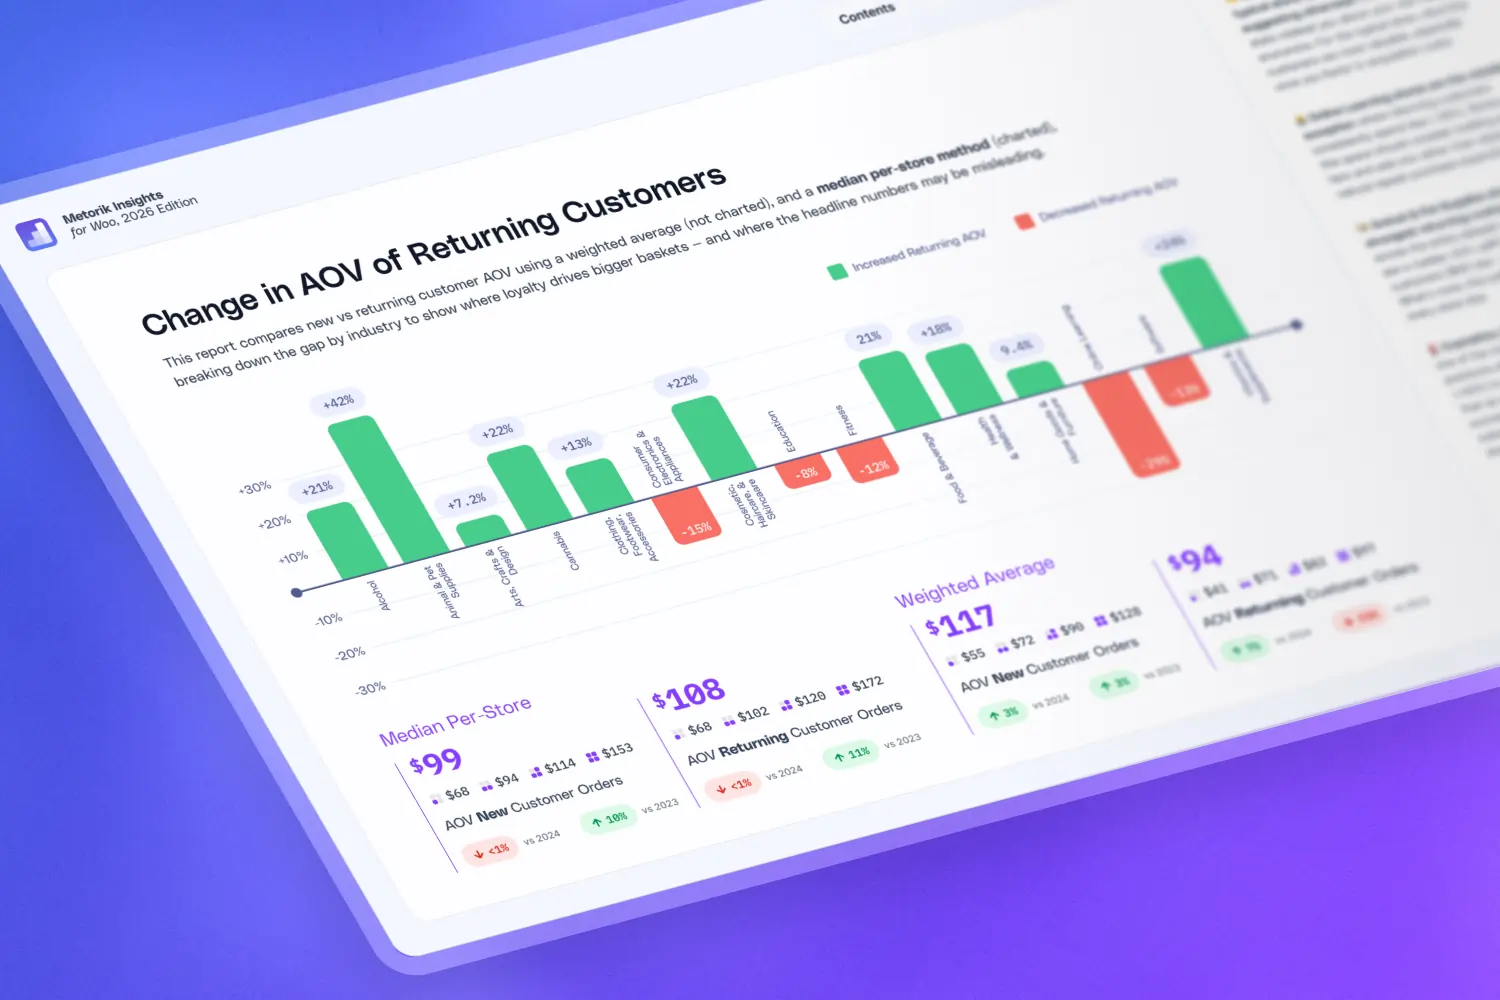
The change in AOV of returning customers is VERY industry-dependent
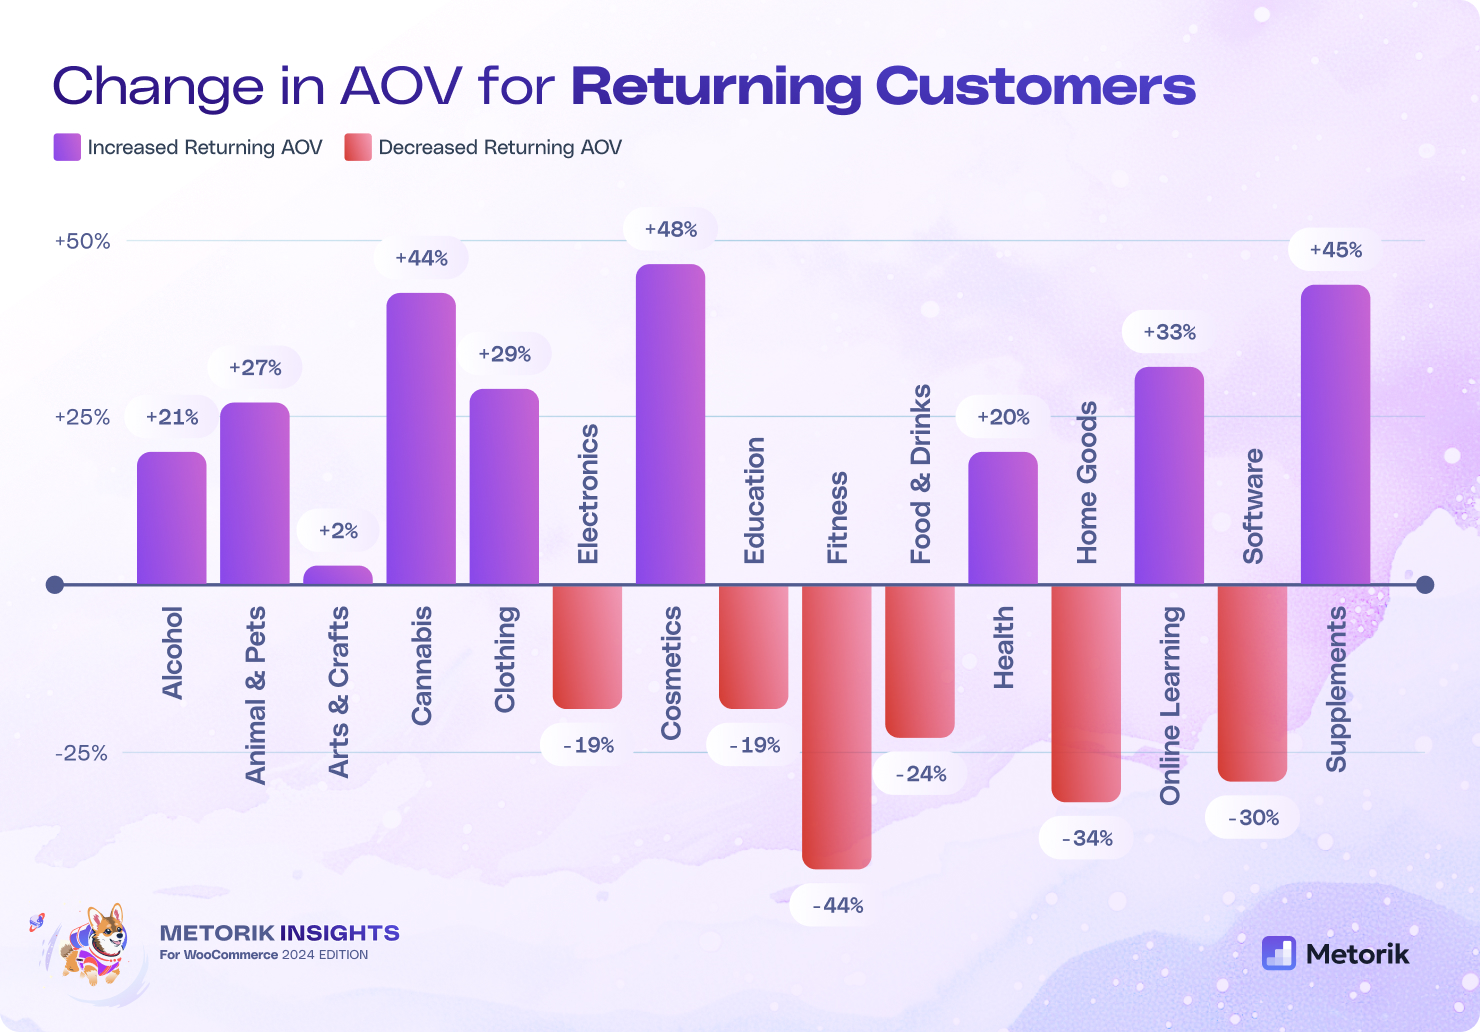
When we take an average across all industries, returning customers typically only spend 5% more than first-time customers. Intuitively this feels a little low right?
However when we break it down further, what we actually discover is significant swings between stores in different industries which suggest successful stores are leveraging different business models, tailored to their customer’s needs.
For example, if we look at stores in the Fitness industry, you can see that returning customers typically spend 44% less on subsequent purchases. It may be that they bought the expensive piece of equipment in their first order, then came back for accessories or supplements to go with it.
On the flip side, looking at stores in Cosmetics, Haircare, and Skincare, returning customers typically spend 48% more than in their first order. (Anecdotally, when I purchased some natural face moisturizer recently, I took up their offer of a $10 sample pack, but if I do decide to order from them, their products are all around $40-60 so my return order will likely be around $100-150.)
So whilst it is true to say generally returning customers spend more, you really need to be asking what’s true and valuable for your customers, for your store in the industry which you’re operating.
Other key WooCommerce End-Customer stats
Abandoned carts typically have a higher AOV ($156) than placed carts ($119). However, recovered carts have almost the same value ($155) as abandoned carts, suggesting if you can get the customer back using a cart recovery email and maybe a discount code, you’ll capture a much higher value than if they haven’t abandoned.
People are more likely to start a subscription on Mondays (16%), and are least likely to cancel their subscription on Saturdays
WooCommerce Globalization Insights
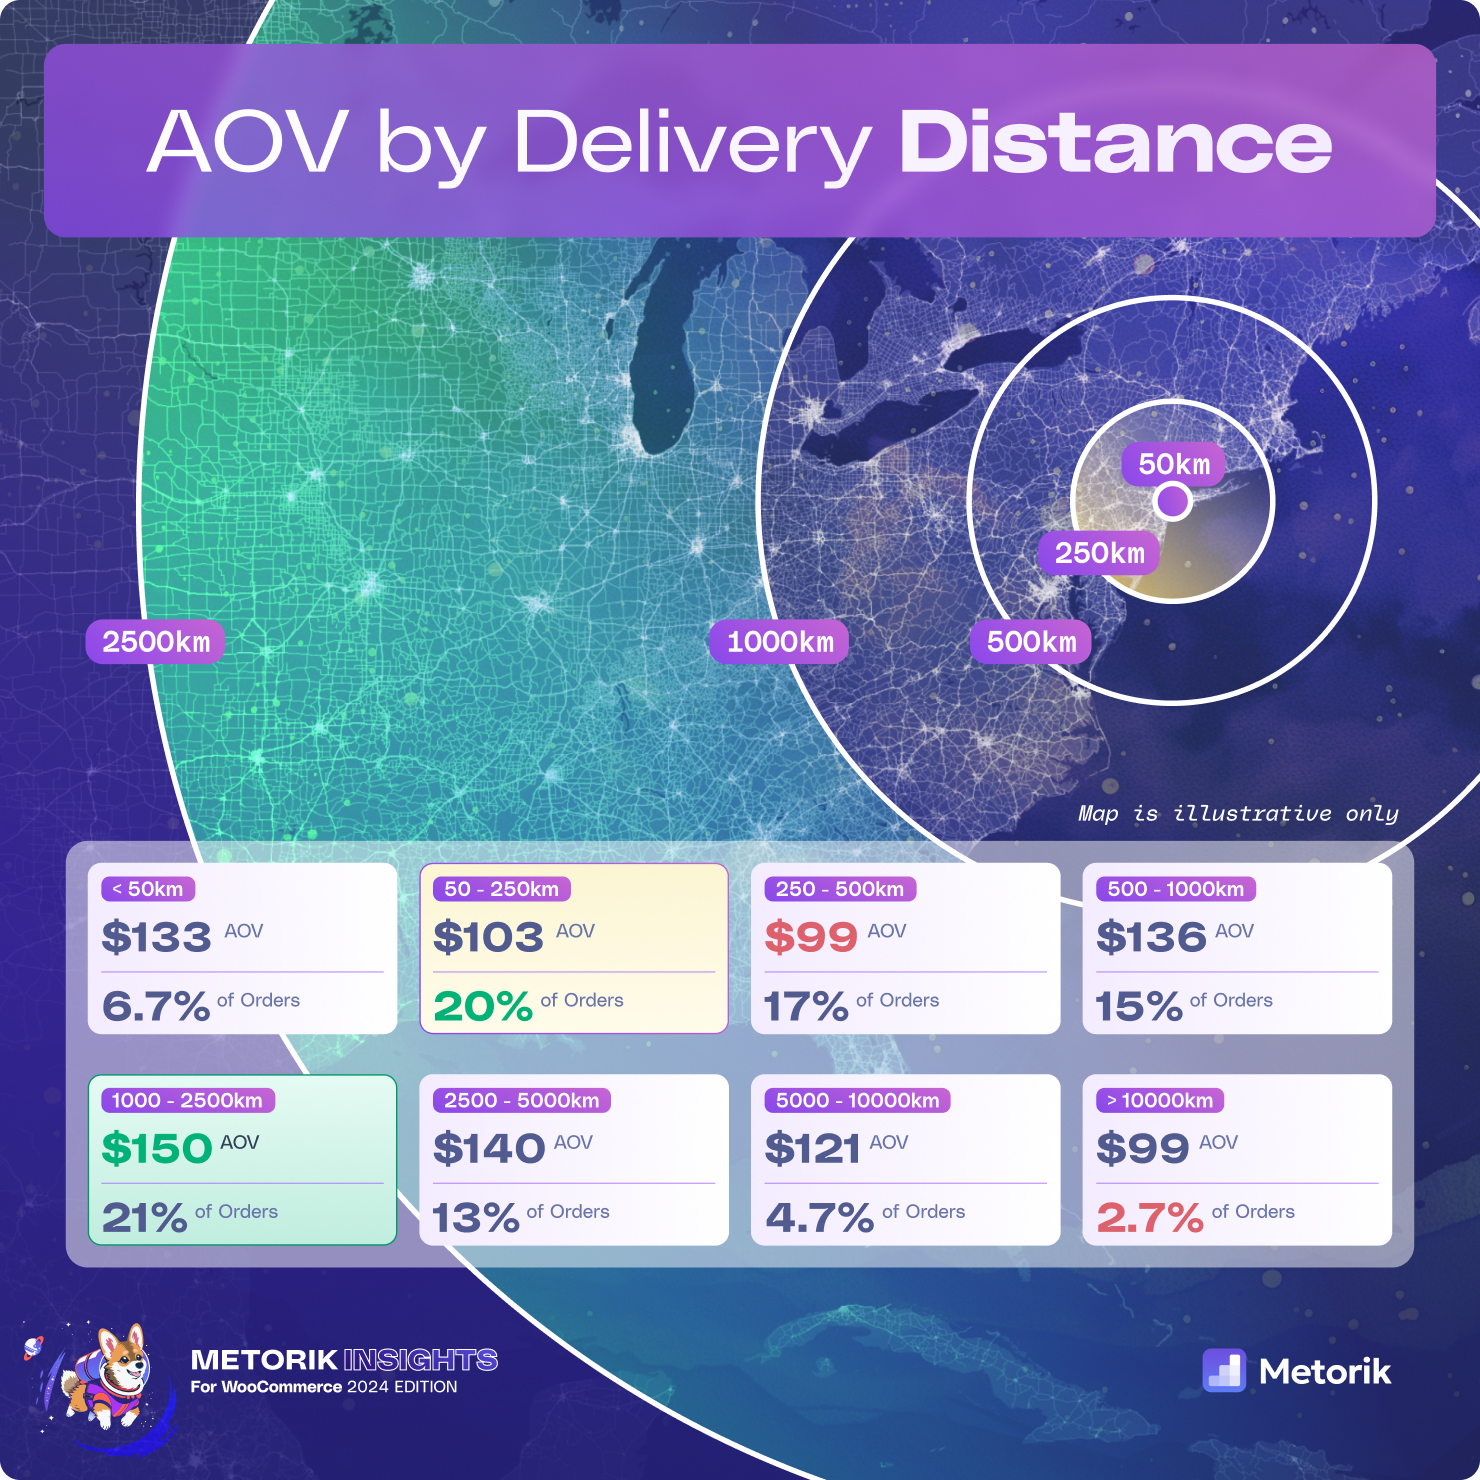
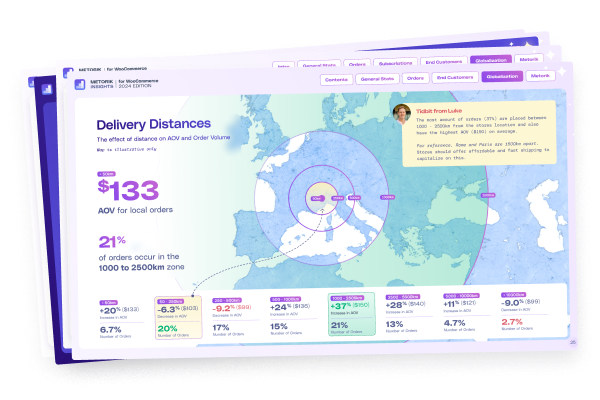
Customers who live 1000 - 2500 kms (620 - 1550 miles) away from your store location typically spend 37% more
We were able to uncover the average distances between stores and their customers, and the subsequent effect that this distance has on their metrics.
After reviewing the resulting data, there were two zones that stood out to us the most:
50-250km (31-155 miles) – Customers in this distance from the store had a high likelihood of ordering, but typically spent a little bit less.
1000-2500km (620-1550 miles) – Customers living quite a distance from the store typically spent a substantial amount more. This may be due to the customers ordering less frequently but in bulk to avoid shipping costs, or perhaps due to the customers being more remote and having fewer options available locally. In reality it’s likely due to both these factors and many more.
Other key WooCommerce Globalization stats
The median (not average) number of countries a store typically sells to is 3
Customers ordering in a currency different to the stores’ default currency, typically spend 26% more
Orders paid via Bank Transfer were, on average, 99% higher in value
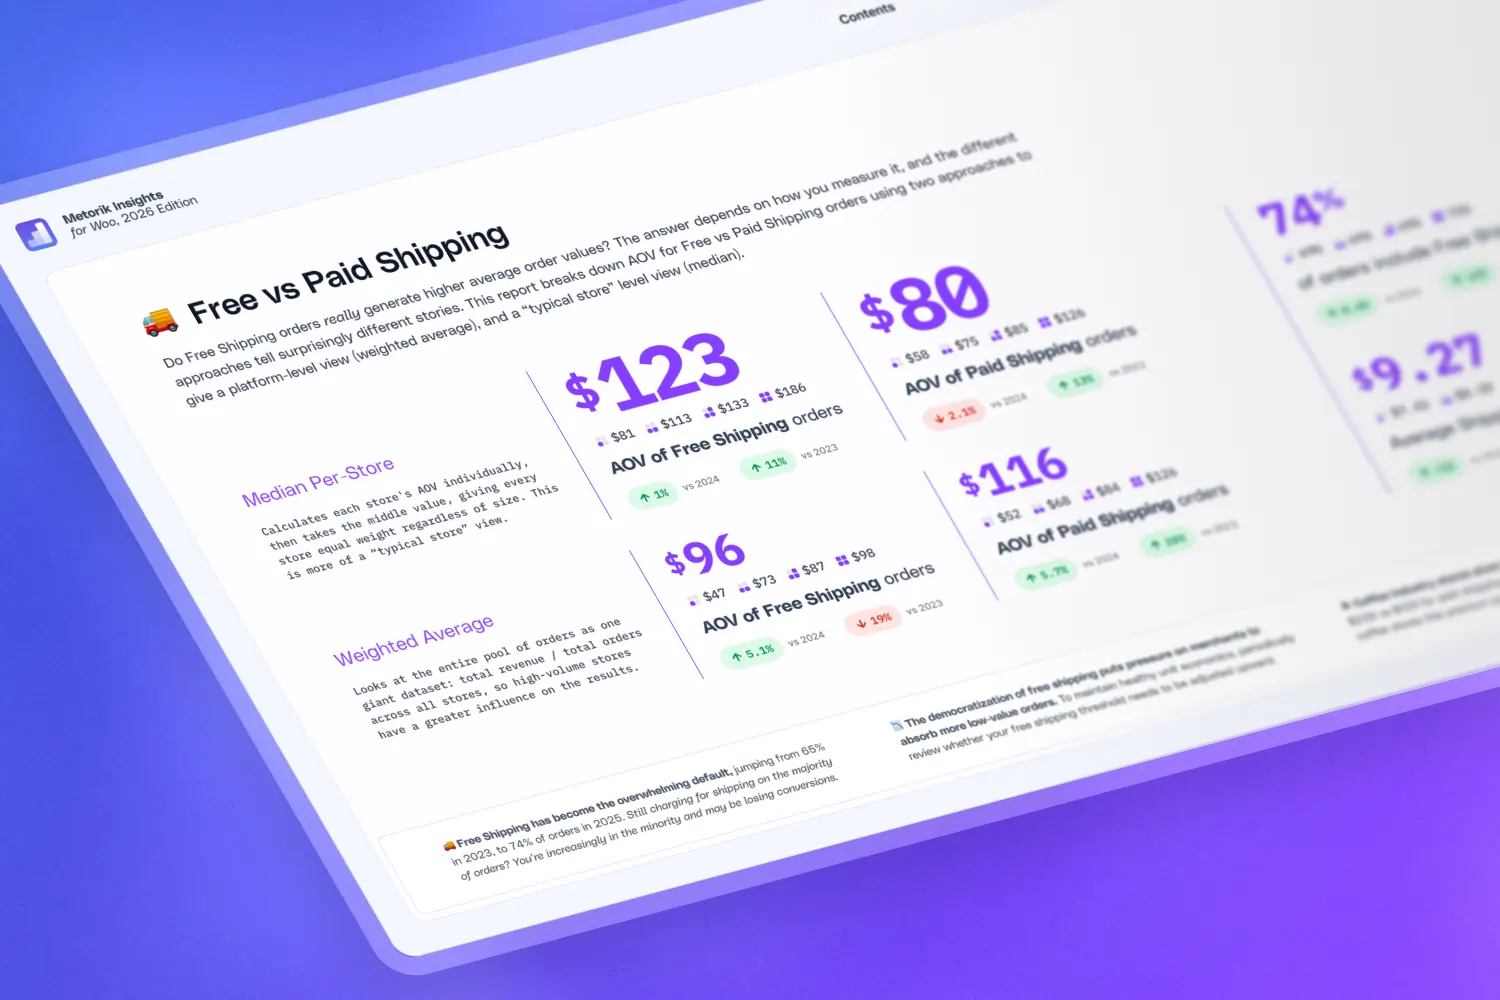
66% of all orders include Free Shipping
Download the full Metorik Insights for WooCommerce report
Grab a coffee and dive in to get a comprehensive understanding of these insights and more. To download the full 30-page report, visit our Metorik Insights page.