
I created Metorik's first forecasted sales report back in the early days when first creating the app. Admittedly, it wasn't great. It used a simple growth formula and didn't take enough factors like seasonality and trends into consideration.
Years later, our team had a tough decision to make. Remove the subpar forecast report altogether, or re-write it from the ground up so it provided more value. We decided to do the latter, and quietly released an improved forecast report a few months ago while we were at WordCamp Asia.
While in Bangkok, sitting at a bar one night, Eric had an epiphany. What if we added a forecast button to every single chart in Metorik? A lot the product has been built through moments like this, so we didn't hesitate to jot the idea down and Eric started building it a few weeks later.
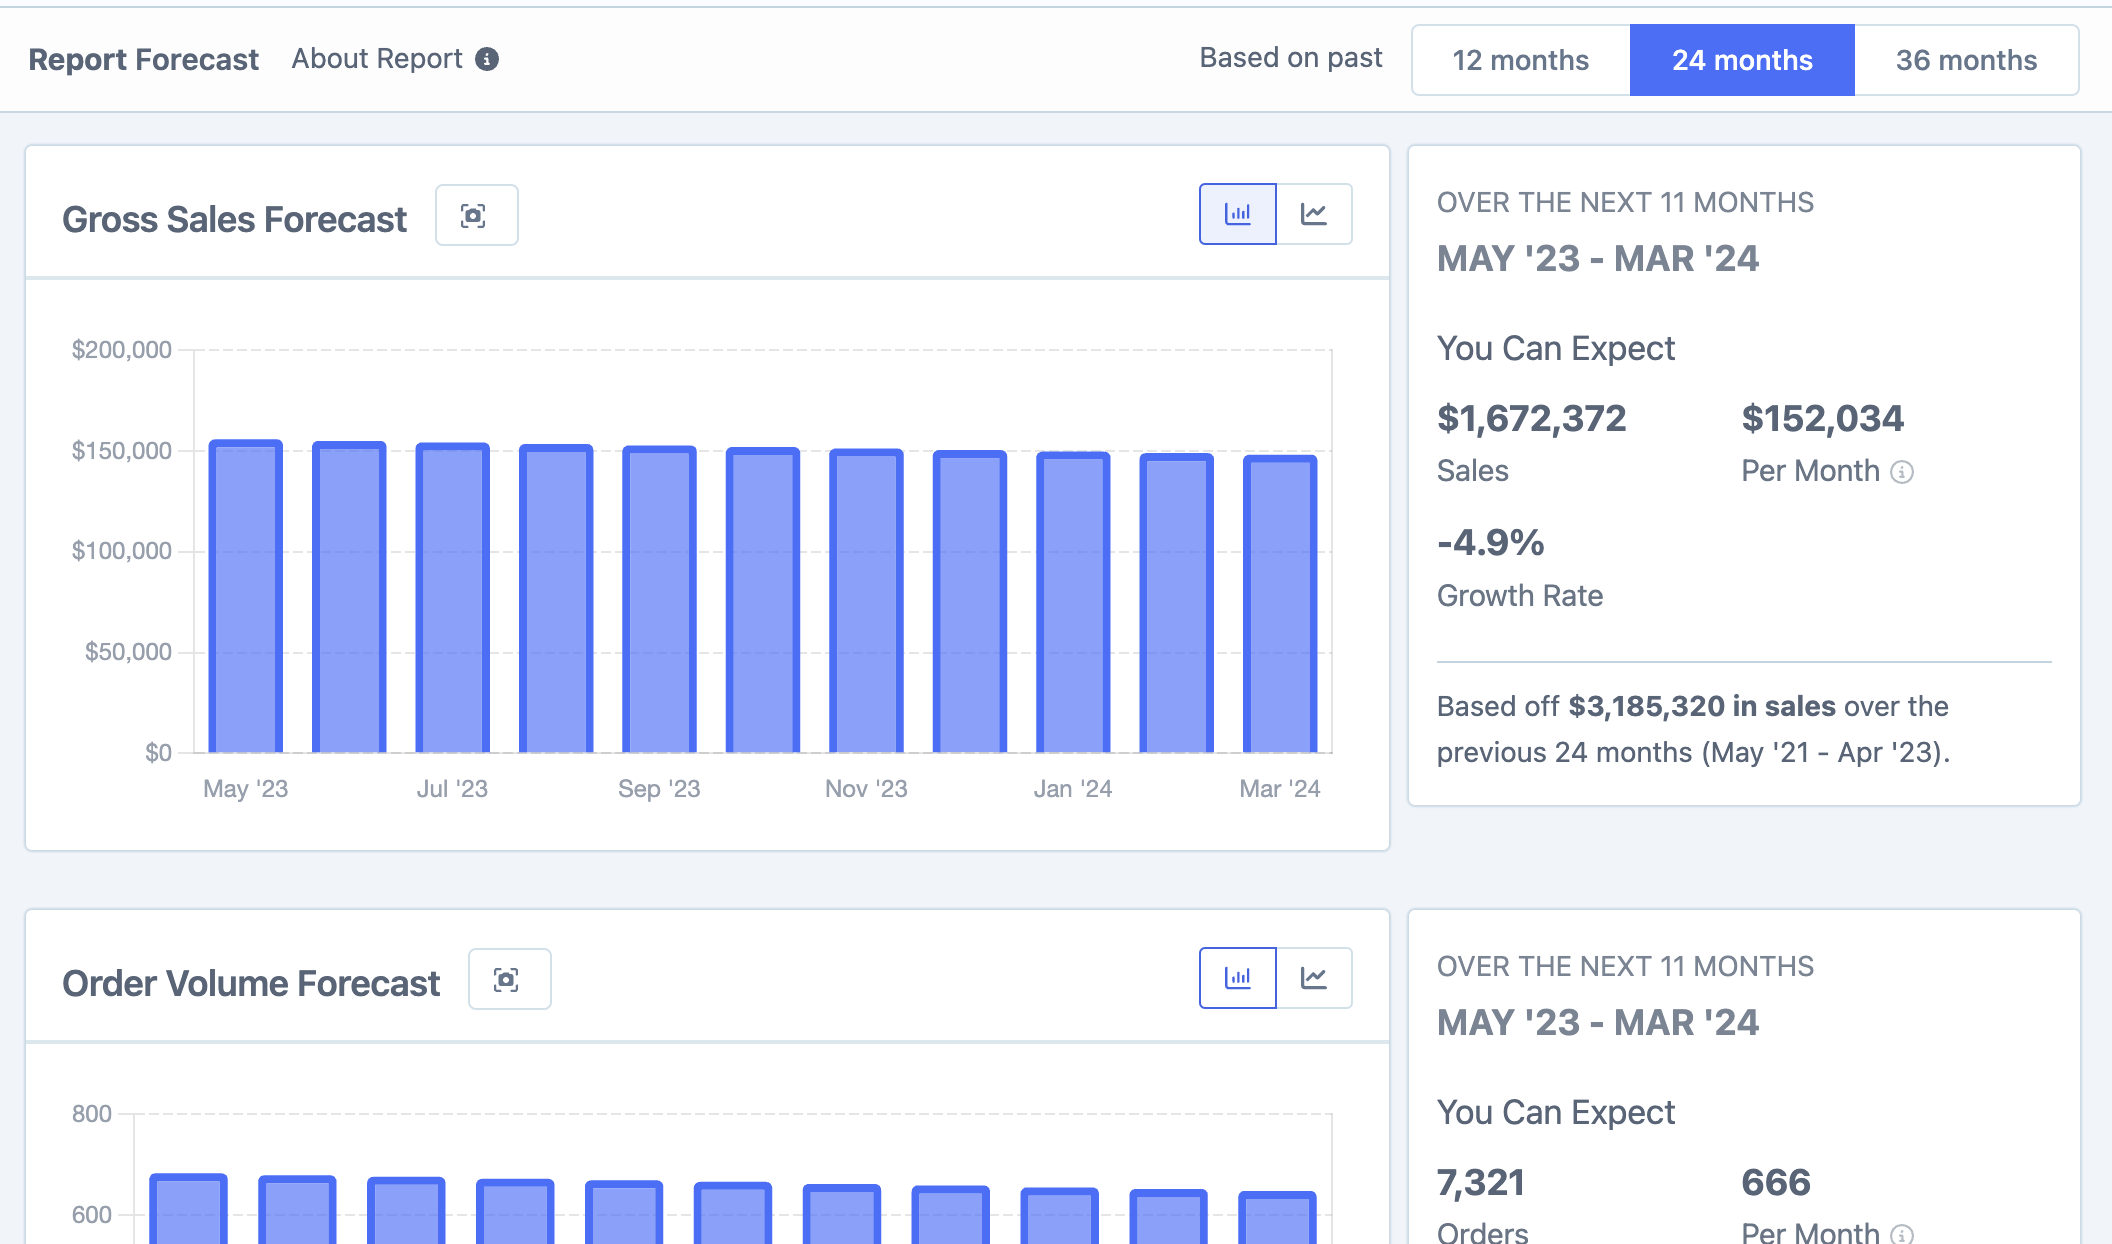
Enter the new forecast button, found above most charts in Metorik:

Click the magic wand and within a couple seconds, the chart will expand to show a forecast built off the existing chart data.
It's available on almost every chart, from MRR reports, to coupon usage reports, to the compare products report:
On the surface, it's quite a simple addition, but when you pair it with some of our other recent features like report segmenting and chart downloading, it's exciting to think of how they can be used together to create truly meaningful insights.
We hope you find this new feature useful, and we look forward to improving it further.