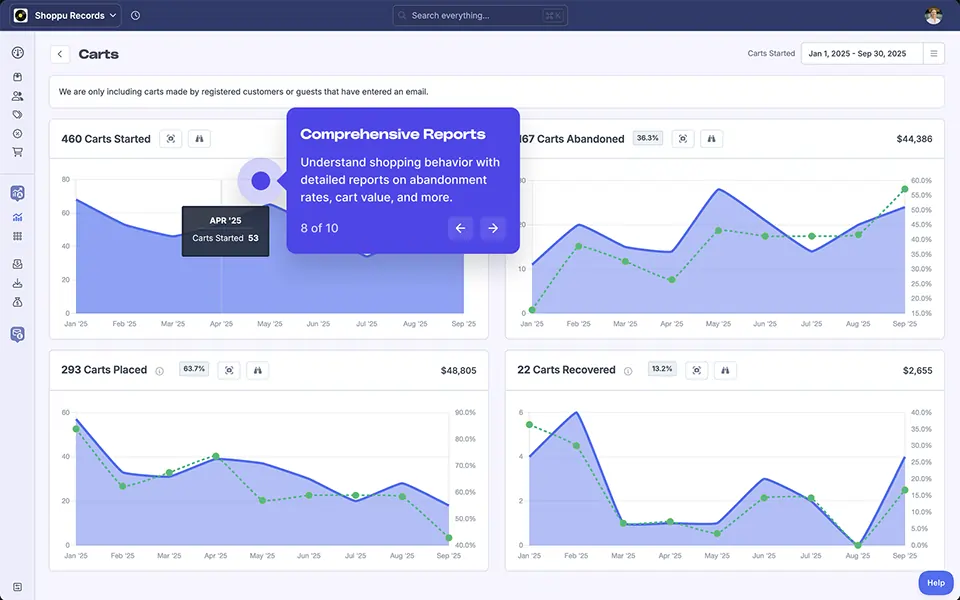
Understand your store like never before
with Metorik’s suite of Analytics & Reporting tools
- Real-time Data
- Over 75 Reports
- Instant Filtering
- 20+ Integrations
- Built for Shopify & WooCommerce
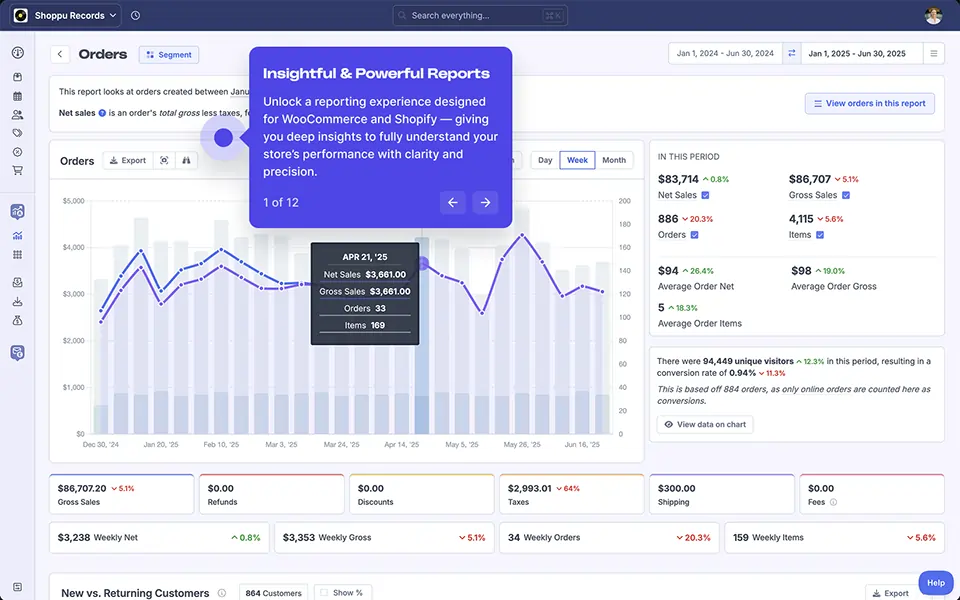
Powering Customer Segment insights for the world's best brands:


Unlock the Reports Shopify and WooCommerce don't give you.
Metorik provides the reports and tools leading eCommerce businesses rely on.
Get answers, quickly
Metorik’s reports and segmenting load in milliseconds, not minutes, so you can get your answers quickly, and get back to business.
Discover ReportsDeep dive, without Excel
Using our powerful Segmenting system you can dig right into your store’s data with unrivalled filtering options.
Discover SegmentingAutomate your reporting
Segment your store data and email it to your team or external stakeholders automatically, daily, weekly, or monthly. You’re in control.
Check out DigestsGet clear on your profit
An accurate picture of your store’s profitability, updated live with every new order. Track product COGS, shipping & transaction costs – even costs from a custom field.
Learn more about Profit ReportingSee your advertising ROI
Sync ad costs from Google, Facebook, TikTok, Pinterest, Microsoft (Bing), and even custom costs from a synced Google Sheet or CSV file
See the full list of IntegrationsIdentify top channels
See where your customers are coming from with Metorik’s source tracking and reporting tools. Filter by UTM values, landing page and/or referring domain.
Brands loving Metorik’s powerful reports
These are the reports you’ve been looking for… A new hope for your eCommerce data
Revenue Reports
Track gross and net revenue, filtered or grouped by any product, customer or order data point to get deep insight into your store’s performance.
More on Revenue ReportsOrder Reporting
Explore orders by customer tags, order status, payment, shipping or location info, even email engagement. Almost anything is possible.
More on Order ReportsCustomer Reports
Show new customer trends, map locations, and group them by product, role, or custom fields, all with insights into LTV and cohorts.
More on Customer ReportsSubscription Reports
Metorik delivers the crystal-clear subscription metrics; MRR, Churn, LTV, Cohorts, vital for your subscription business to survive and grow.
Explore Subscription ReportsDiscounts & Refunds
Find out what your BFCM discounting strategy is really costing you. Track coupon or discount performance, and monitor refund rates.
More on Discount ReportingRetention Reports
Understanding CLTV is vital for your business’ long-term health. The higher your average LTV, the more you can outbid your competitors…
More on Retention ReportsProduct Reports
Explore detailed reports on your product sales, trends, profit margin, and inventory forecasts – answering your critical operational questions.
Explore Product ReportsDevice Reports
According to the WooCommerce Insights report, 62% of orders come from mobile, but AOV on desktop is 77% higher. Is this true for your store?
More on Device ReportsCart Reports
Get visibility of every checkout – abandoned, in-progress, or placed. This isn't just data; it's a live look into your customers' buying decisions.
Explore Cart Reporting

⭐⭐⭐⭐⭐
Shopify's analytics are good for basic analysis, but if you're needing anything more sophisticated, Metorik is hands down, the best option we've found.
— Simon McIntyre

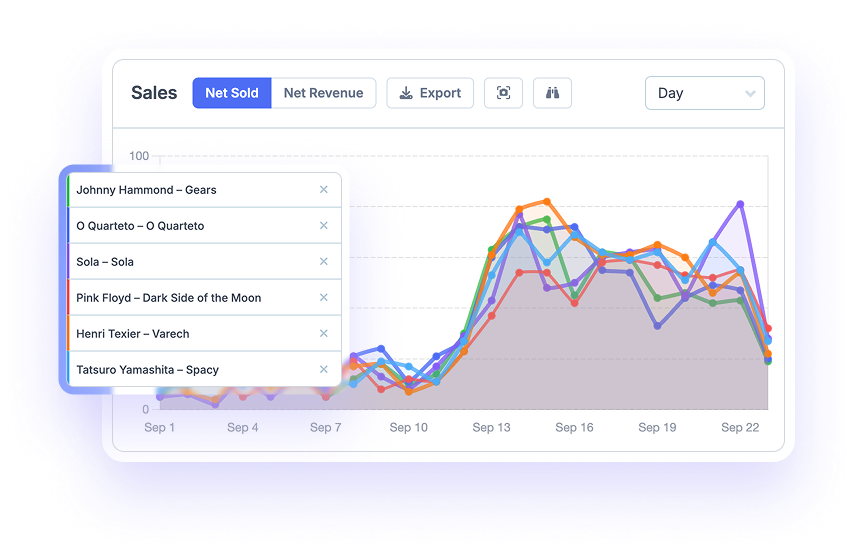
Show what’s helping (or hurting) your growth
Access detailed sales reports, segmented by product details, customer information, or sales channel – all updated in real-time to provide you with accurate and actionable insights.
Answer the questions you’ve always had, but haven’t been able to (until now). Metorik makes almost any query or comparison possible.
Review your product and category sales over time to see what product lines are due for a refresh, or could do with a spicy new marketing campaign.
Combined with our Source Reporting you’ll even be able to see the actual results from your campaign on the uplifted product sales.
Top level revenue is easy to track, but understanding the details behind the headline number is far more valuable, but often not easy to see.
Are you receiving a lot of orders from Facebook, or are you acquiring profitable, repeat customers? With Metorik, you won’t have to guess.
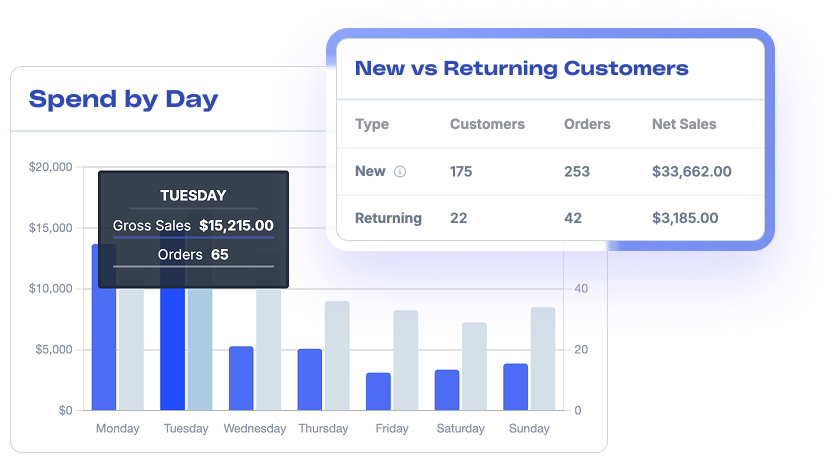
Get order insights that inform your strategy
Explore a range of detailed order reports that categorize by status, payment method, and fulfillment progress, giving you complete operational visibility.
- New vs. Returning Customers
- Order Value Distribution
- Item Count Distribution
- Time between Created & Shipped
- Average Order Net/Gross
- Orders grouped by Currency
- Spend by Day/Hour
- Orders grouped by Custom Field
- Refunds by Country
- and many more...

Finally understand your Customers
View detailed customer reports that highlight purchasing behaviour, average spend, and lifetime value (LTV) to better understand your customers and identify any leading cohorts.


⭐⭐⭐⭐⭐
There are very few products/pieces of software that are produced to the level of excellence that Metorik offers.
Everything works — seamlessly. It integrates — perfectly. My customer service team uses it exclusively — no slow WooComm backend. Rapid access to data, reports, and insights. Can't praise highly enough.
— Zac Zelner

Grow your MRR with precise, timely insights
Analyze subscription trends by product, customer group, and billing cycle to identify opportunities for retention and expansion.
In just a few clicks you can filter thousands of subscriptions to find out which products are your “A Players”, and which might need to be benched.
By tracking churn by subscription billing period, you can easily see if you should promote a cheaper, higher frequency subscription, or a more expensive monthly, or annual one.
Back up your intuition with data to make educated decisions on when to renew your products, onboarding, or new customer experiences.
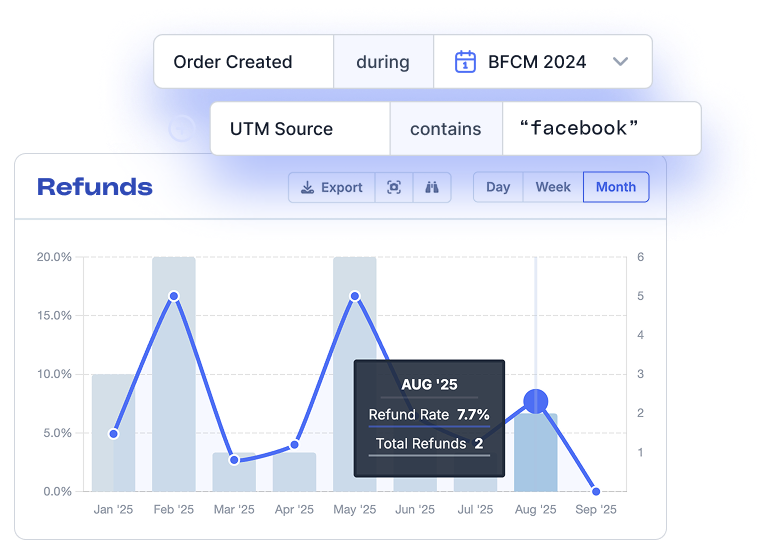
Optimize discounts and refunds, protect your profits
What’s your BFCM discounting strategy really costing you?
Sure you might acquire a bunch of new customers, but are they profitable? Or are they just after a haul which they’ll likely return 80% of?
Not tracking your discounting and refunds is like knowing you have holes in your pockets, but pretending you don’t. Metorik’s powerful refund and discount reports will help you find the holes and equip you and your team with the information to decide what to do.

Customer retention & LTV without a spreadsheet in sight.
Metorik’s customer segmenting gives everyone in your team the power to identify when and where you attracted your ideal customers.
Once you’ve identified the customer cohort, dive deeper to find out why. A successful Google Ads campaign? A loss-leading new product with outstanding repurchase rates?


⭐⭐⭐⭐⭐
Metorik is my FAVORITE app - marketing, sales, and customer service information all in one place.
I'm able to quickly pull reports, make business decisions, troubleshoot customer issues, etc. I seriously added Metorik to my Shopify account immediately after signing up - it's a must-have for me and my team.

Stock insights that power efficiency
Evaluate product performance across categories, sales channels, and time periods to guide smarter purchasing, restocking, and pricing decisions.
Stop letting stock-outs drain your revenue and frustrate your customers. Metorik’s inventory tools give you the foresight to stay ahead of demand and optimize your cash flow.

See device revenue, and target smarter sales
Break down performance by desktop, mobile, and tablet to identify trends and optimize user experiences across all platforms.
According to the WooCommerce Insights report, , 62% of orders come from mobile, but AOV on desktop is 77% higher.
Is this true for your store? Find out what surprises are in your data.
Turn abandoned carts back into profits
Analyze real-time cart activity alongside your recovery campaign results, equipping you to convert missed opportunities into measurable profits.
See what every visitor adds to their cart, and what they end up purchasing. This isn't just data; it's a live look into your customers' buying decisions.
Discover most-added products, even if they aren't your best-sellers yet.
Identify your most-abandoned products to find opportunities to improve product pages, pricing, or unexpected high shipping costs.
See if your website improvements, copy changes, or customer experience and support are actually lowering your cart abandonment rate.
Analytics & Reporting FAQs
Can't find what you're looking for below? Read our Help Docs
eCommerce analytics is the process of tracking your sales, customers, and marketing data, like in the different reports outlined above, to understand how your store is performing.
For Shopify and WooCommerce stores, it’s essential for making informed decisions about your growth, retention, and product strategy. Metorik gives you advanced eCommerce analytics that go far beyond the basic dashboards built into Shopify and WooCommerce.
Shopify’s built-in reports are fine for basic sales and traffic data, but most merchants quickly find their limits. For example:
- No deep customer segmentation
- No cohort or deep subscription analysis
- Limited customisation and filtering
Metorik fills those gaps with detailed Shopify reports covering customer lifetime value, refund trends, subscription insights – all filterable by thousands of metrics, and exportable to CSV when and how you need. Many customers call it the “reporting superpower Shopify is missing.”
Yes. WooCommerce’s default reporting is very slow and very limited, showing only surface-level sales data.
Metorik gives WooCommerce stores full analytics and reporting powers: subscription tracking, customer segmentation, revenue cohorts, product reporting, and you can even create investor-ready dashboards.
The best part, Metorik syncs all your data over to our high-performance servers enabling reporting, segmenting and exporting that’s lightening fast and never impacts your website’s speed.
Metorik supports a wide range of eCommerce reporting, including:
- Top-level reports – sales, orders, and product performance
- Insightful reports – customer behaviour, refund analysis, and campaign ROI
- Predictive reports – subscription churn, forecasting and growth trends
Many stores use Metorik reports daily to guide product strategy, marketing campaigns, and investor and stakeholder updates.
Absolutely. You can set up automated reports (we call them Digests) that run on a schedule and send them by email or Slack. That means no more spreadsheets or wasted hours building reports manually — your sales analysis, cohort tracking, or product summaries arrive automatically, ready to use.
Advanced reporting takes you from simply tracking sales to understanding why they happen. With Metorik you can:
- Identify your most profitable products, categories or customer cohorts
- Track marketing ROI across different campaigns and traffic sources
- Get a clear picture of your store’s costs and profit margins
- Spot trends in customer retention and churn
- Make confident, data-driven decisions about growth
This means less guesswork and more clarity in every area of your business.
Yes. Reports can be shared automatically with team members or third parties.
Many of our customers rely on Metorik’s reporting for wholesale operations, monthly investor updates, and day-to-day decision-making, because everyone can see the right data at the right time.
Unlike many other platforms, Metorik doesn’t charge per user. You can add as many users to your Metorik account as you need – giving direct access to the people that need it, and controlled reports for those who don’t.
Yes. Metorik offers a free trial where you can explore the full analytics dashboard, dive deep into reports, try our automated reports (digests), and even set up cart tracking and send abandoned cart recovery emails.
You’ll see exactly how much deeper your insights go compared to Shopify Analytics or WooCommerce reports before you commit, and could even recover some lost revenue along the way! Start your free trial
Still have questions?
Can't find the answer you're looking for? Chat to our friendly team.
Time you had a birds-eye view of your stores?
Get up and running in minutes. No developer needed.
💳 Metorik is Free for 30 days, no credit card required.


Output: A modern take on music production
With big players in the audio software market like Apple and Ableton, you need to bring something special to the table to truly make an impact.


