Guide
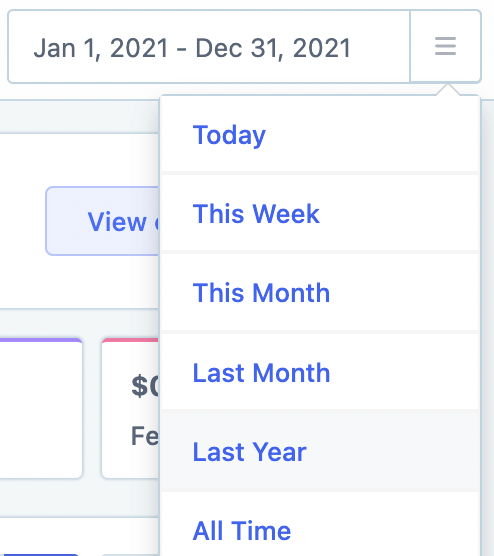
Head to the Revenue Report, and set the date-picker to Last Year.
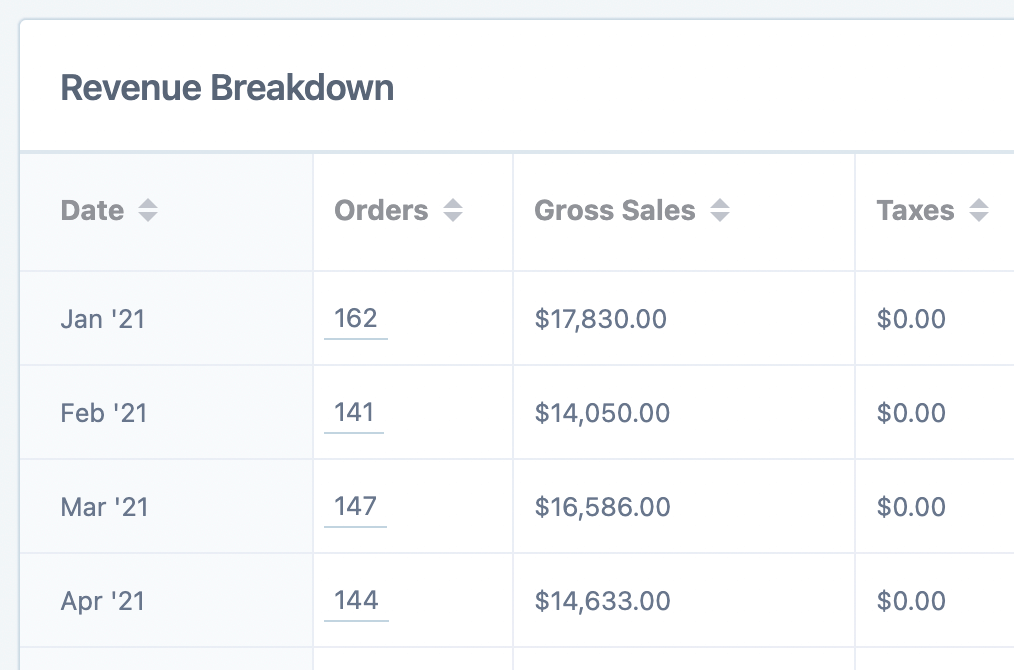
Scroll down to the Revenue Breakdown section where we will see the revenue-related data broken up by month as the default.
On the right-hand of the table, click the Day button:

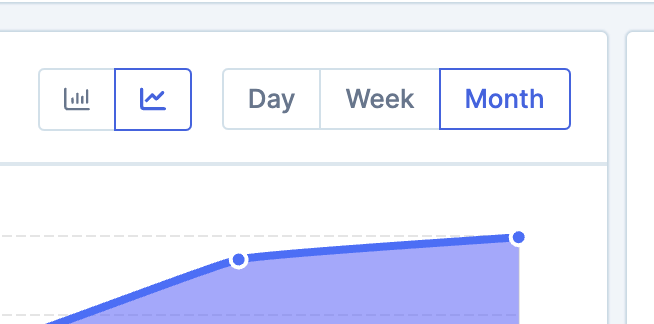
Side note: What if you wanted to see the best selling weeks or months? To do that, simply choose Week or Month from the group by options:
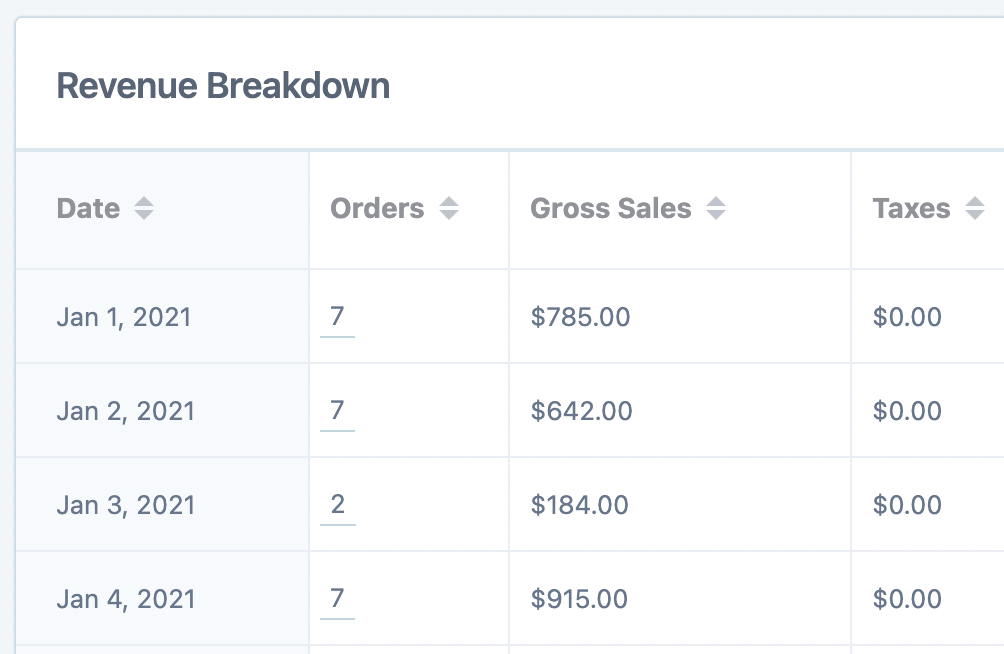
This then gives a nice daily breakdown of the revenue stats for last year:
Now the only thing left to do is to click on the Orders text at the top to sort the data from highest to lowest.
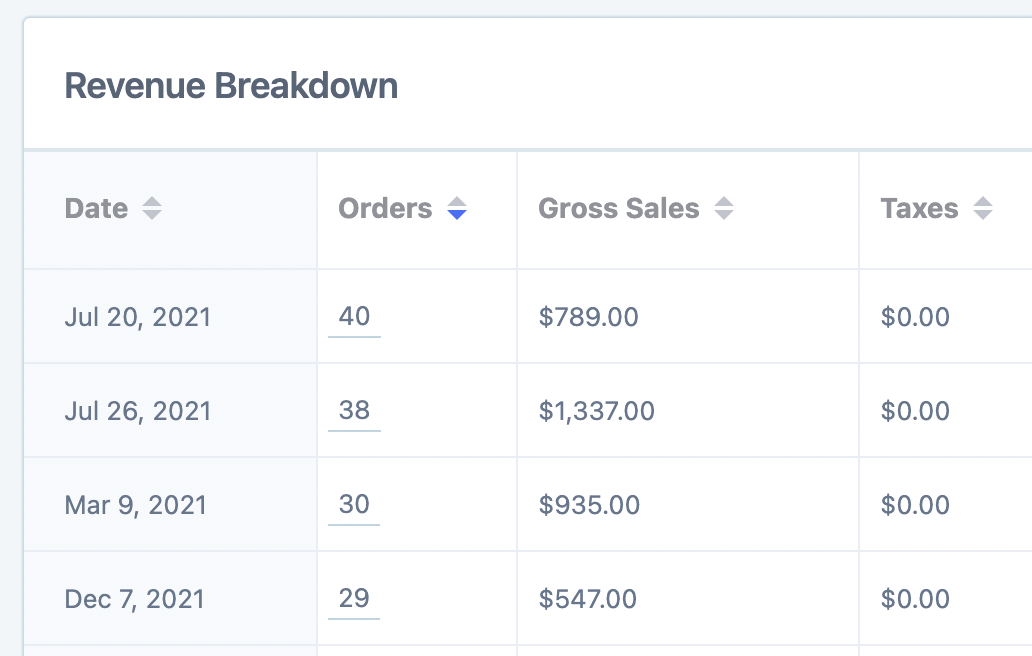
The data you can now see is a daily breakdown of all last year's sales from highest to lowest.
Feel free to play around with the sorting, for example, you might want to click the Orders heading again to sort from lowest to highest, to see your worst performing days.
Additional steps
You can also click the export button to export this data to a CSV for further analysis.
You might even want to tailor some of your email marketing based on the best and worst days. For this, it would definitely be worth taking a look at Metorik Engage.
