Date settings
First, head to the renewals report and select the period you want to see expected revenue for:
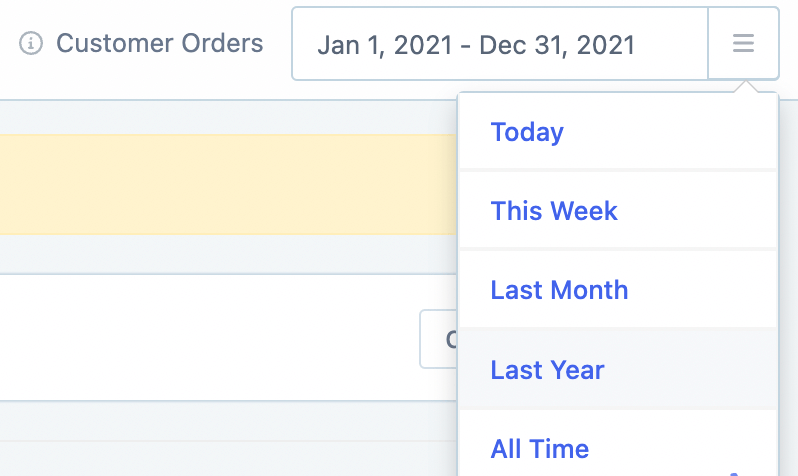
There are several default ranges to choose from, or you can also select your own custom period. You can also control which default date ranges are shown to you in the dropdown from your store's date settings.
Product settings
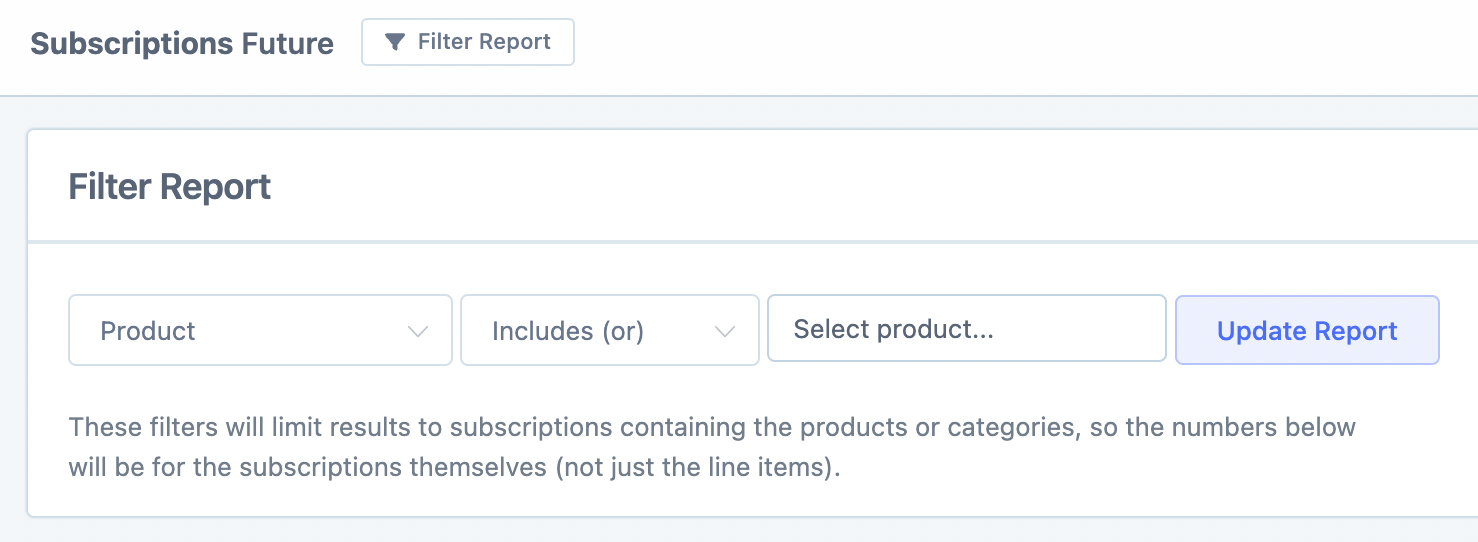
By default, the report will show you renewal revenue for all subscription products, however, you can get more specific by filtering the report by multiple subscription product(s) or categories.
Clicking the Filter Report button at the top will bring up a section to make these choices.
Future renewal revenue
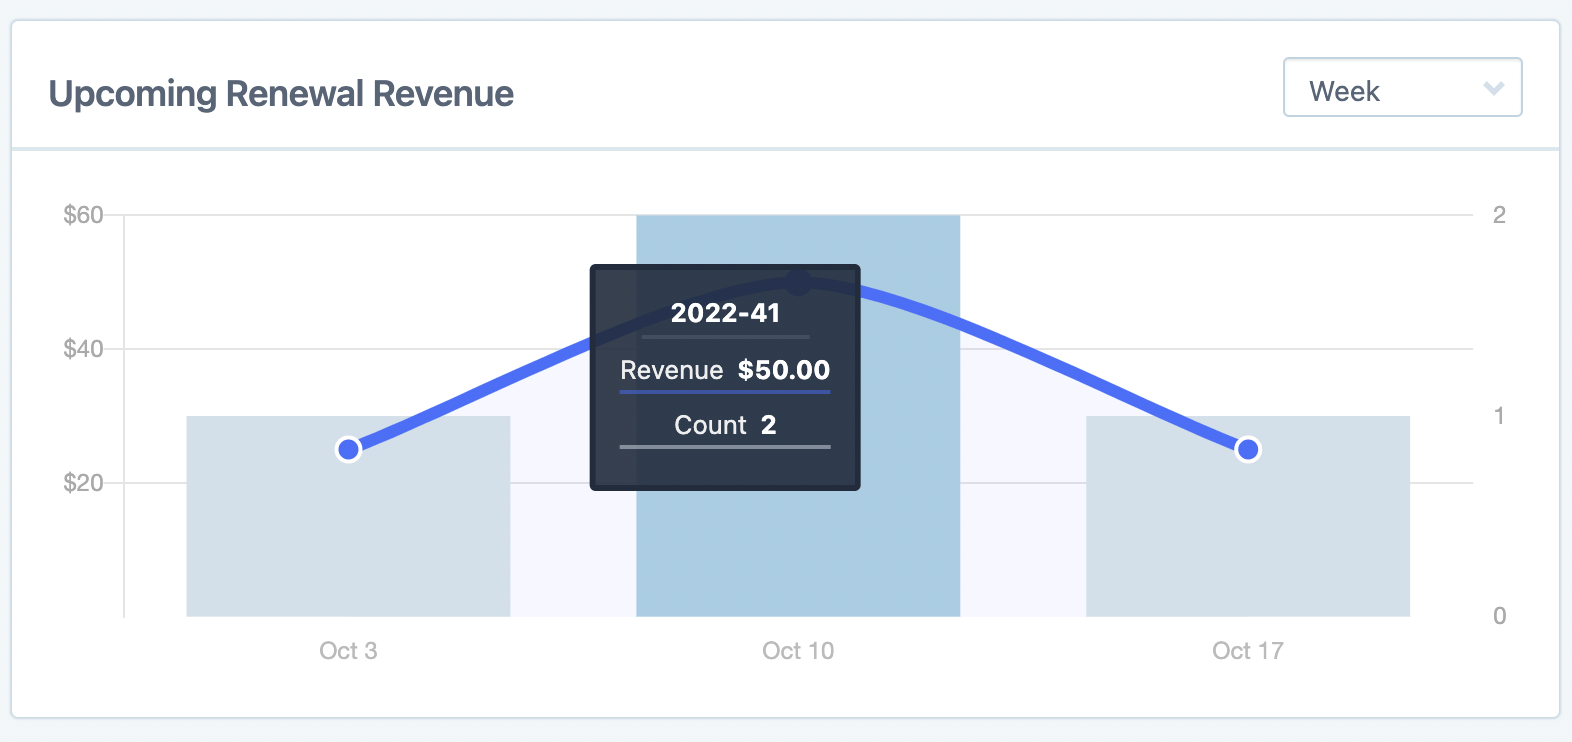
Once you have selected the date range and added any optional filters, you will see the upcoming renewal revenue graph which has the option to group the data by daily/weekly/monthly periods:
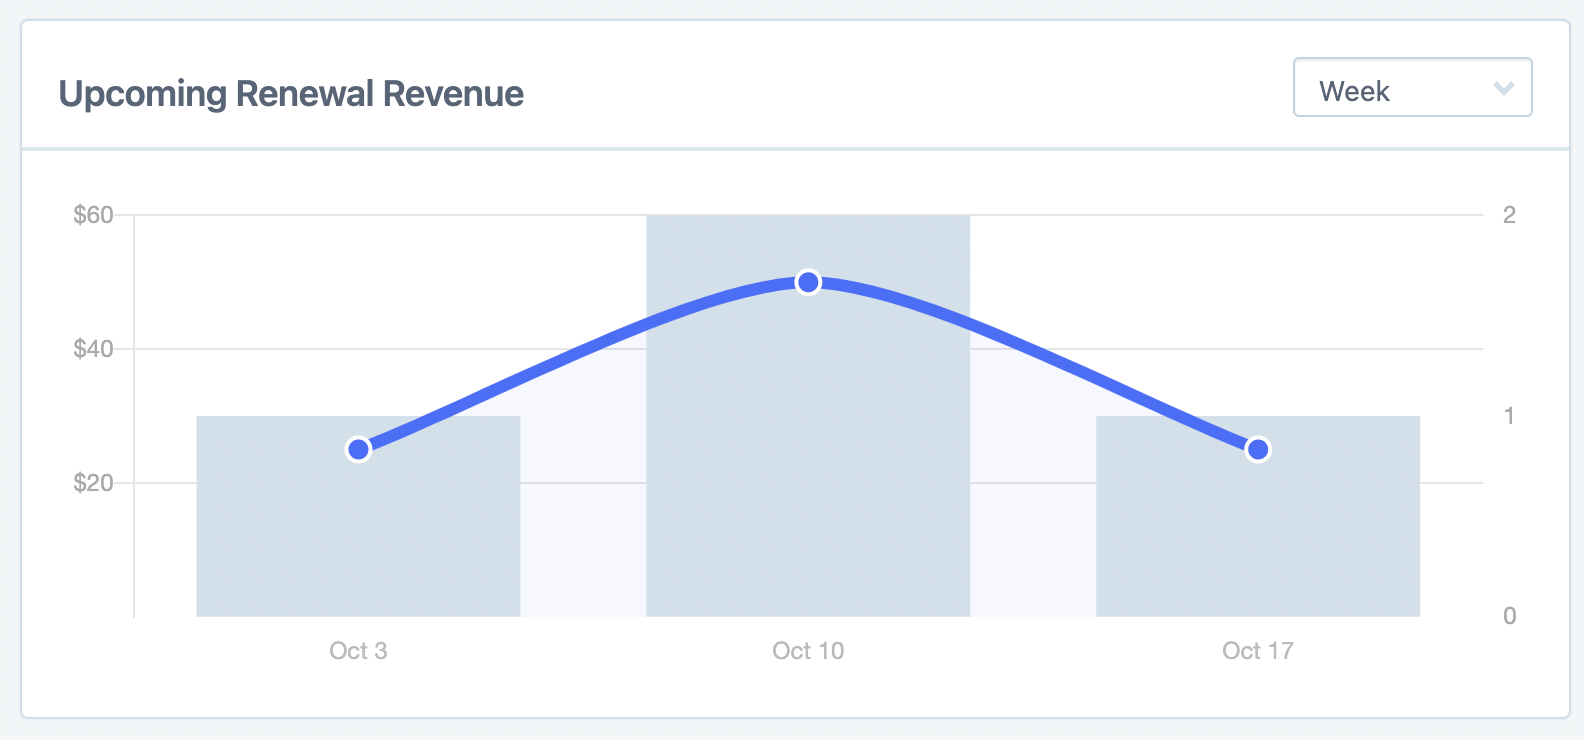
It shows the number of active subscriptions that are due for renewal (bar graph), plus the actual monetary amount that is expected from these renewals (line graph).
You can also hover over any particular day/week/month to see the exact figures:
Totals
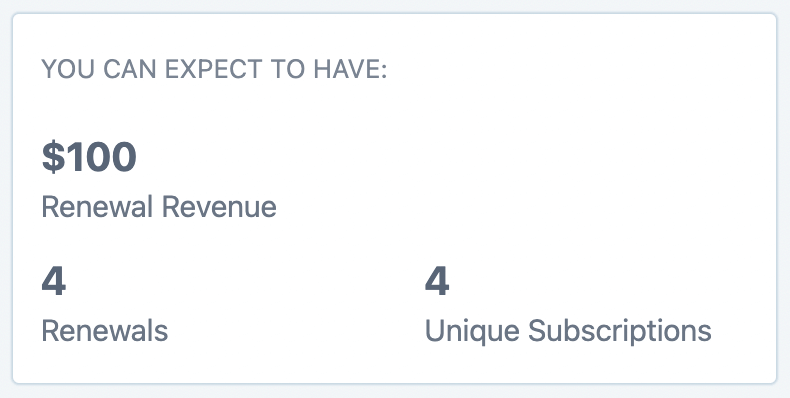
The next section that you will see is a summary of the future renewal revenue data. This includes the total Renewal Revenue, number of Renewals, and the total number of Unique Subscriptions for the period selected:
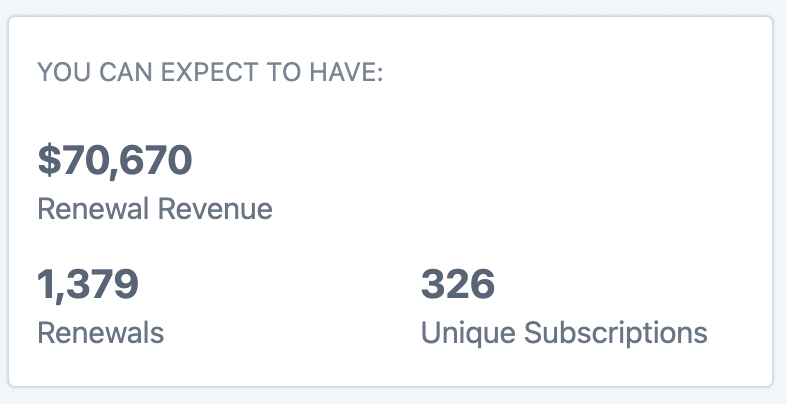
The future renewal report predicts multiple renewals for single subscriptions too. So for example, if a subscription was set to renew every month on the 26th. When you're looking at a date range such as September 23rd - October 31st for example, there are going to be 2 renewals (September 26th, October 26th) for that 1 unique subscription.
As such, the number of Renewals are likely going to be larger than the Unique Subscriptions figure — especially when you are looking at larger time periods where the subscription has multiple renewals within that time frame:
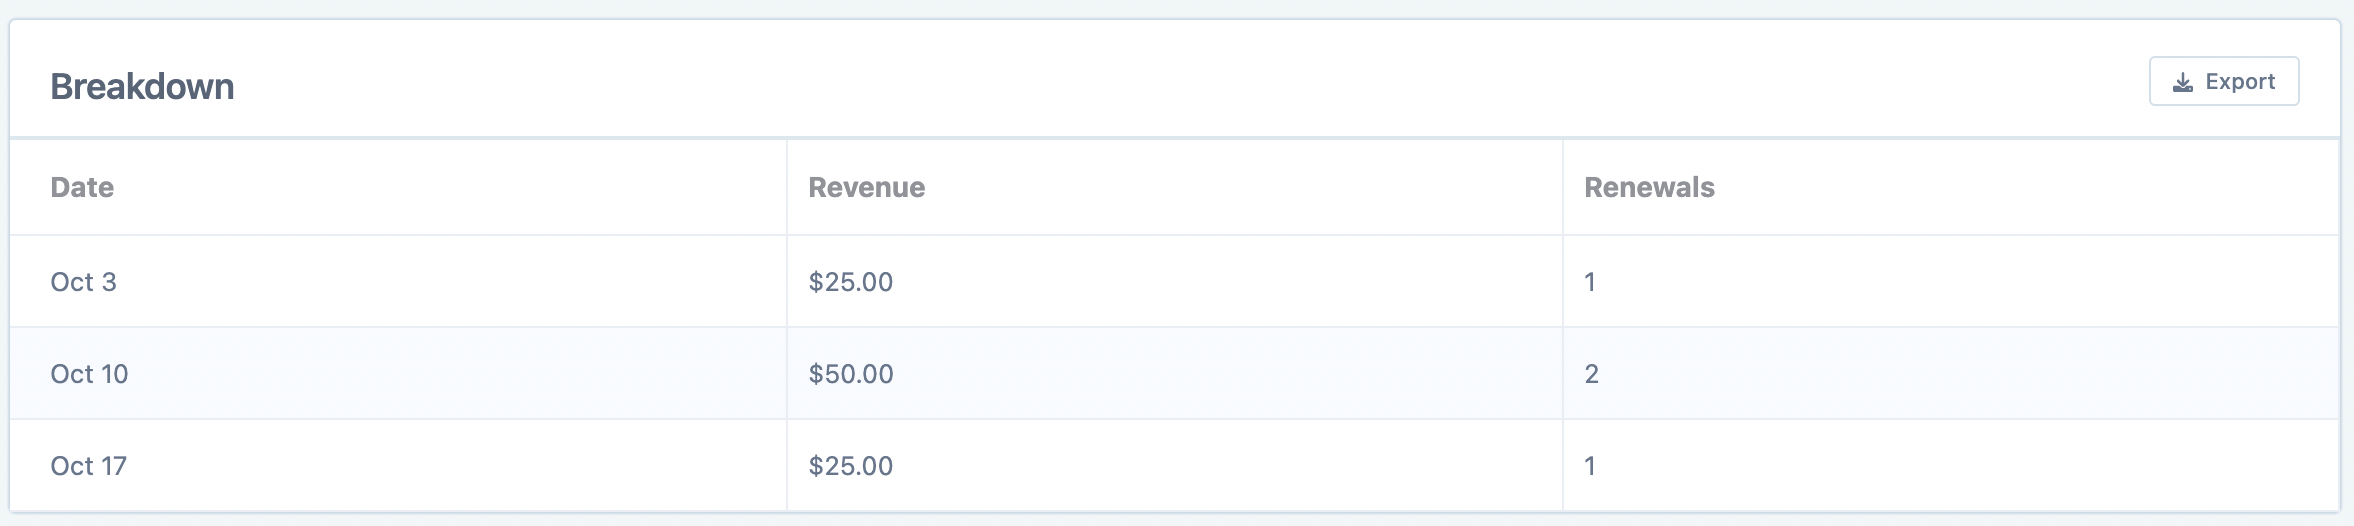
Export the data
Further down the page, there is the breakdown section which puts the graph values into table format, and on the right-hand side, there is an export button that lets you export the data to a CSV.