Customer Retention report
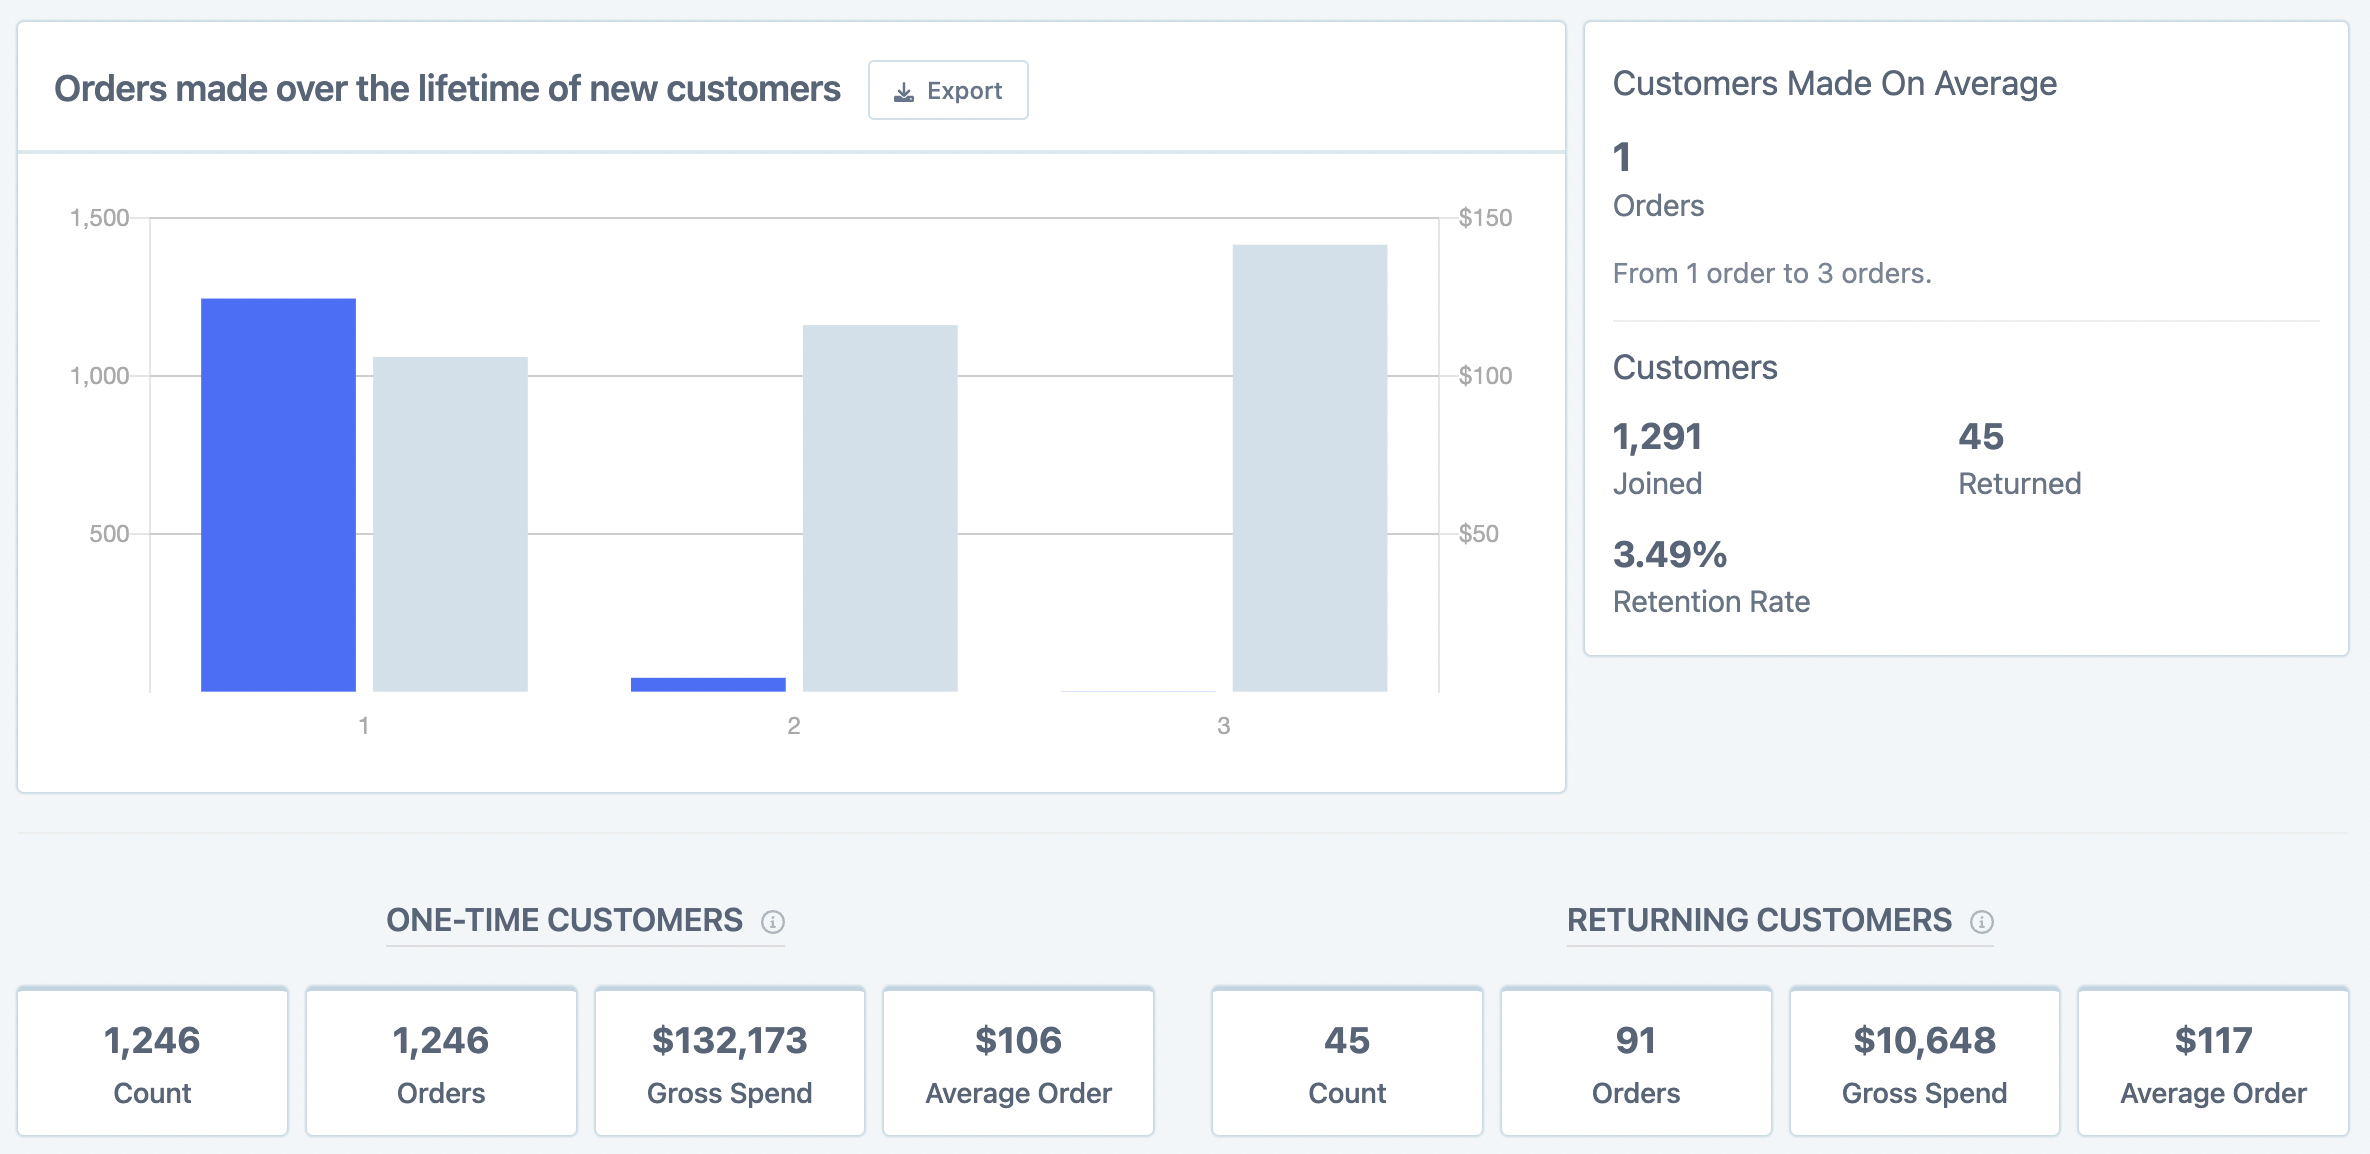
The first option is to look at the Customer Retention report.
This report's date picker (top-right corner) filters your customers by either their joined date or their first ordered date:

By default, this is set to look at the first order date but you can change that in your date settings.
In this report, a one-time customer is a customer that only placed a single order with you in their lifetime and that order was placed in the date range you are looking at. Whereas a returning customer is a customer that placed more than one order with you in their lifetime. Note that their first order will be in the date range you are looking at but their subsequent orders may be after this date range.

Orders and Customers page
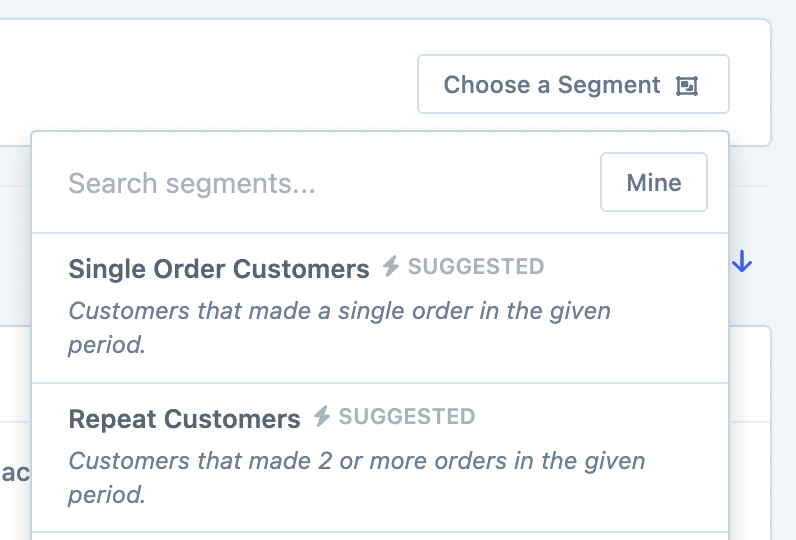
The second way we can do it would be to head to the Orders or the Customers page and use the Segmenting Tool on Repeat Order Customers/Single Order customers.
We already have pre-built segments for these which you can access from the Choose a Segment button.

You can use this option if you don't want to filter for a specific first order/joined date.
After applying the segment you will get a selection of useful stats shown at the bottom of the page e.g.

You'll also be able to Export this data if you wanted and set up recurring exports with the option to customize the exporting columns so that you can export exactly what you need.
Orders report
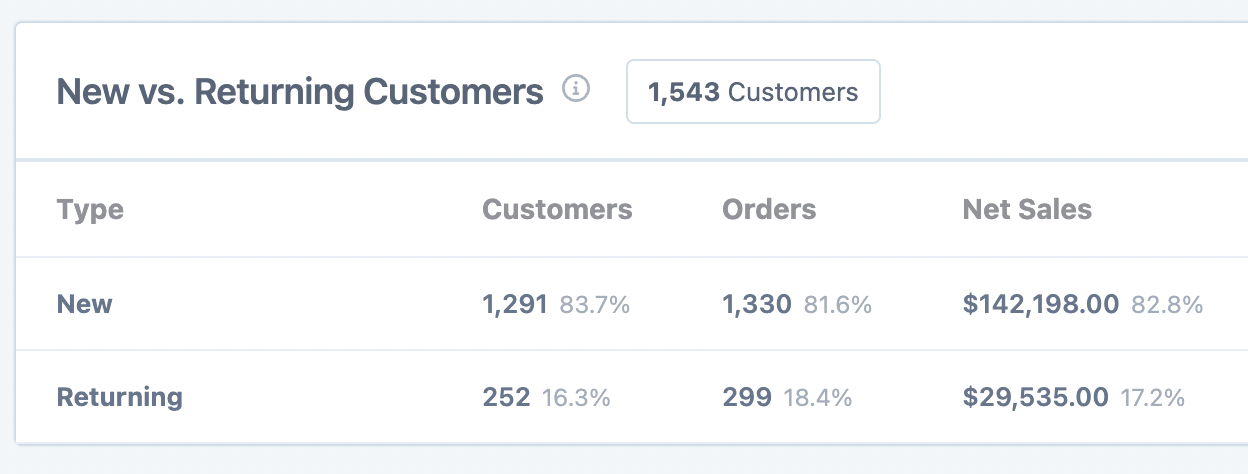
The final way of looking at this kind of data is to look at the Orders Report:

The date picker filters for the order created date, not the customer's first order/joined date:

Returning Customers in this report are customers who joined the store before the date range chosen to look at (even if they have not ordered before).
