-1549438730.jpg)
To bring in the new year, we have been hard at work putting the final touches on our newest exciting feature; Customer Cohort Reports.
Cohort analysis has become one of the most powerful tools in being able to track and understand customer behavior over their lifetime; and we're excited to show you how you can now do this is Metorik. We also have an accompanying help doc which explains cohorts in more depth.
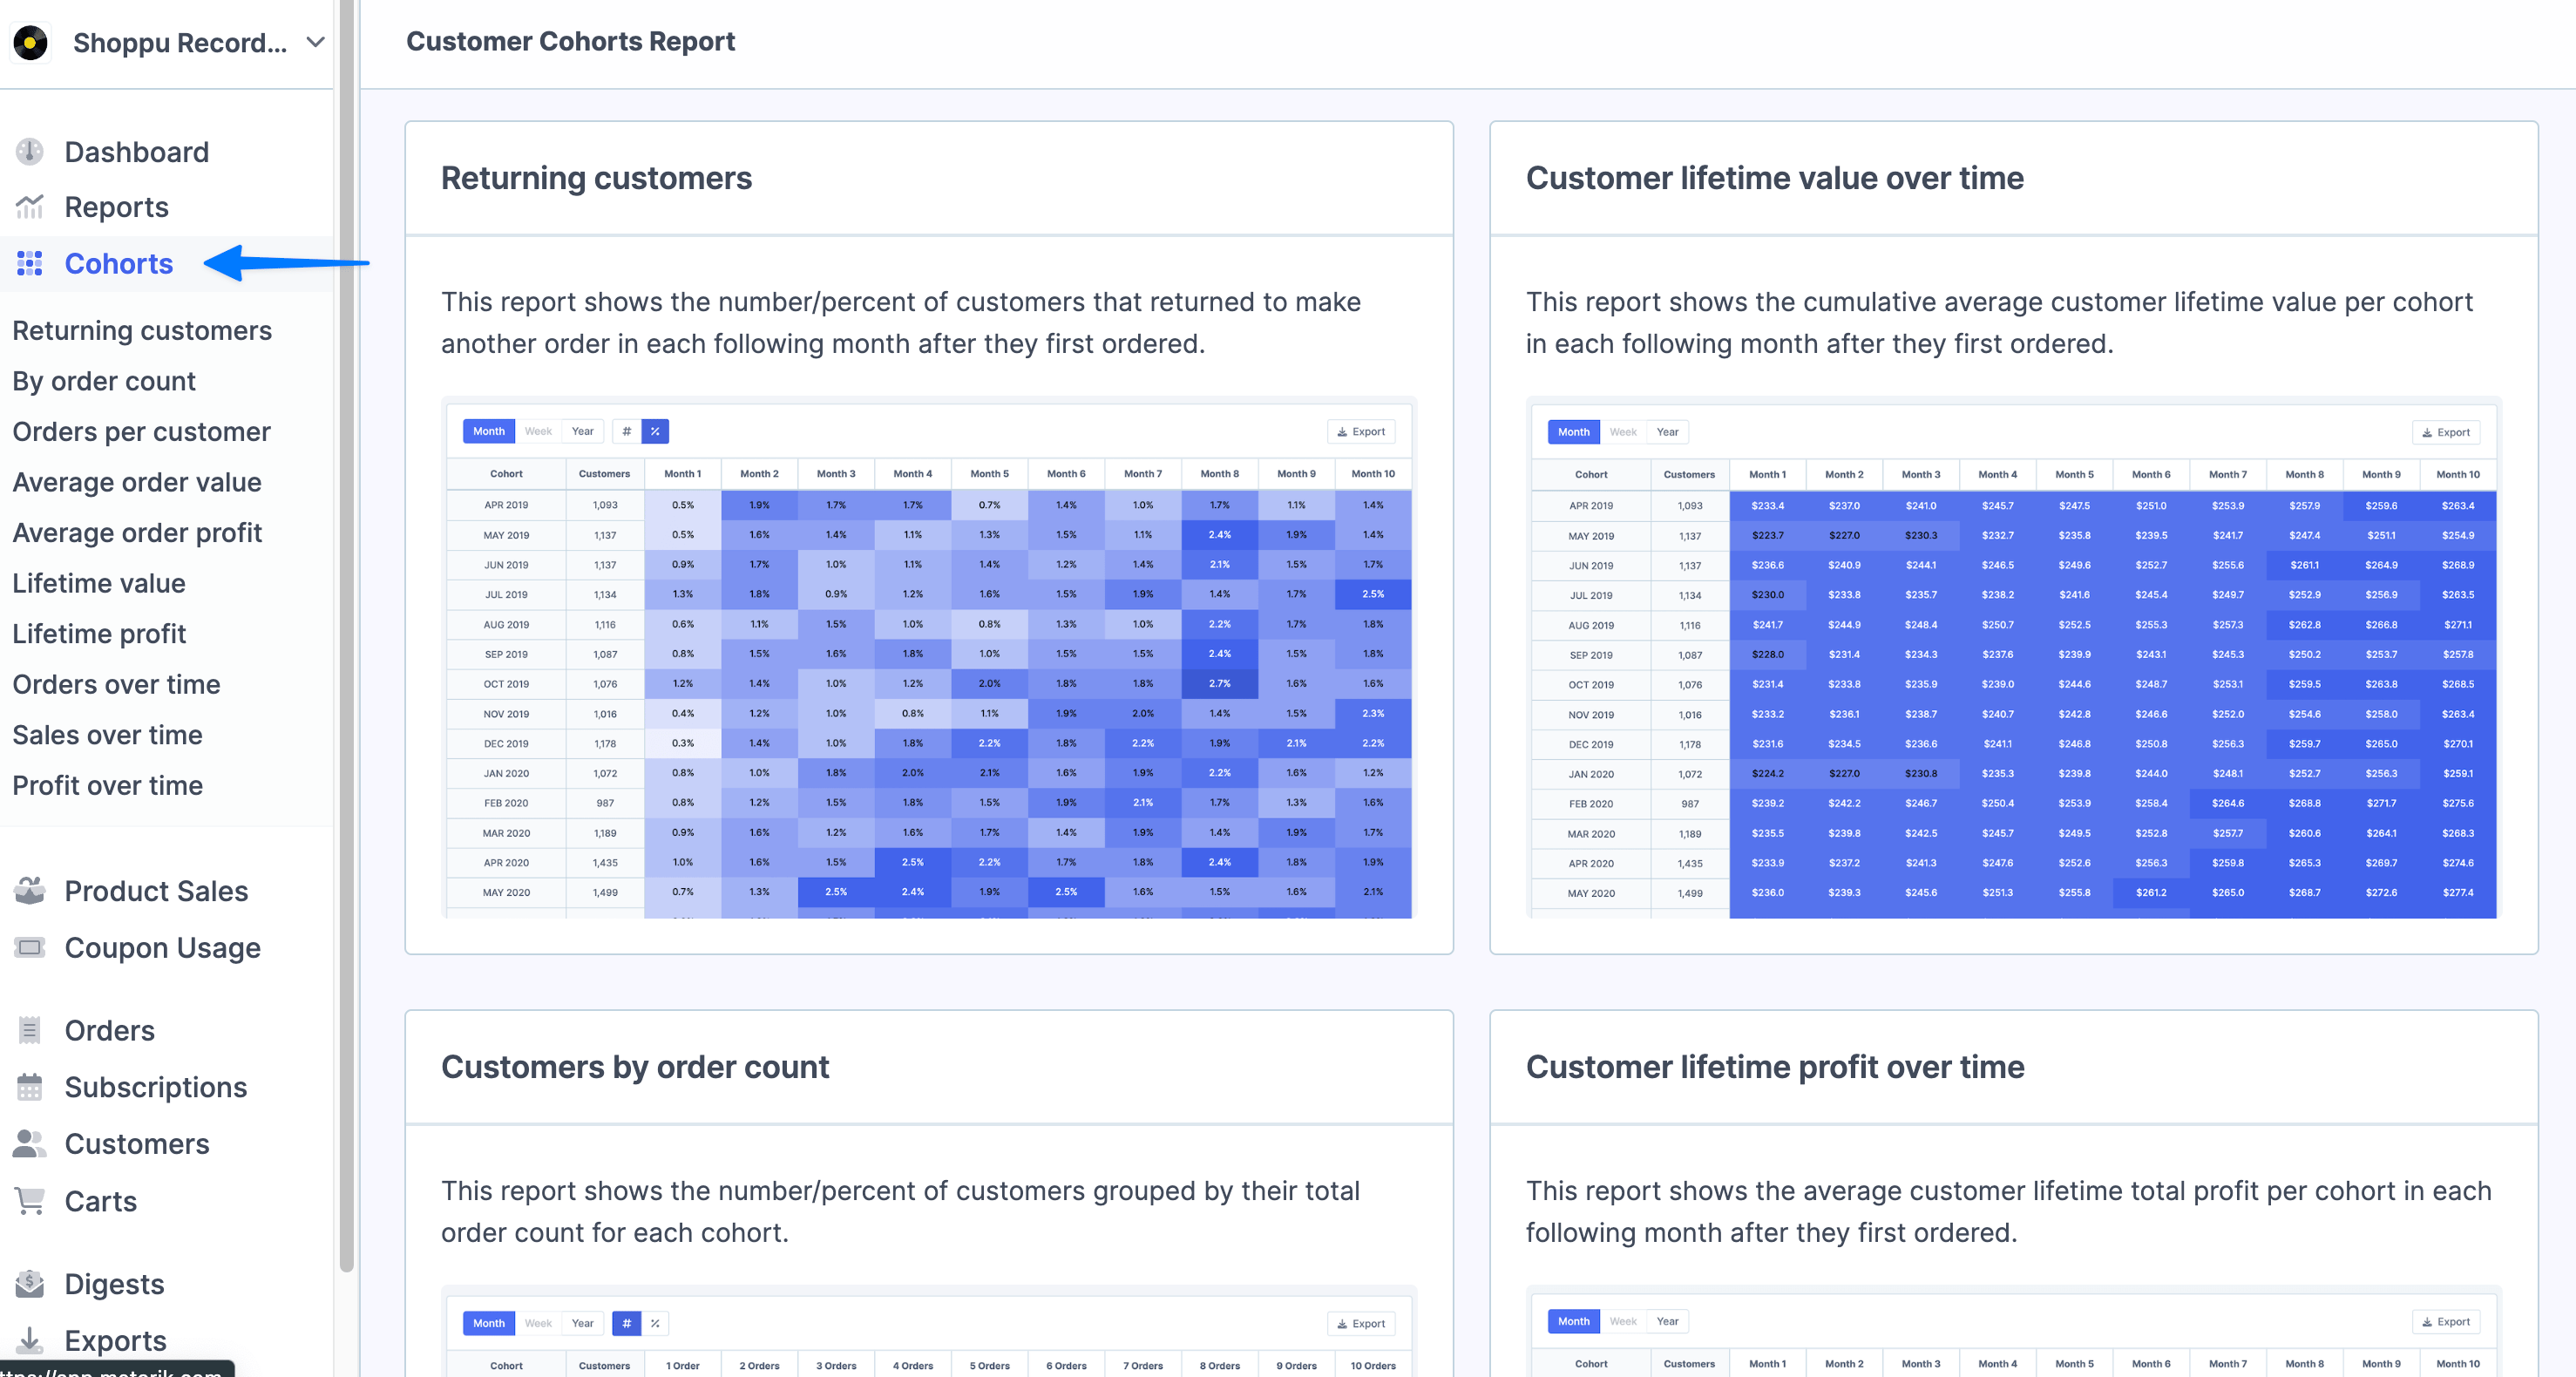
Each cohort report shows you different insights about your customers and list of these can be found on the new cohorts page. This page will also give you a quick summary and screenshot of each report:
Here is a screenshot from the Customer Lifetime Profit Cohort Report:
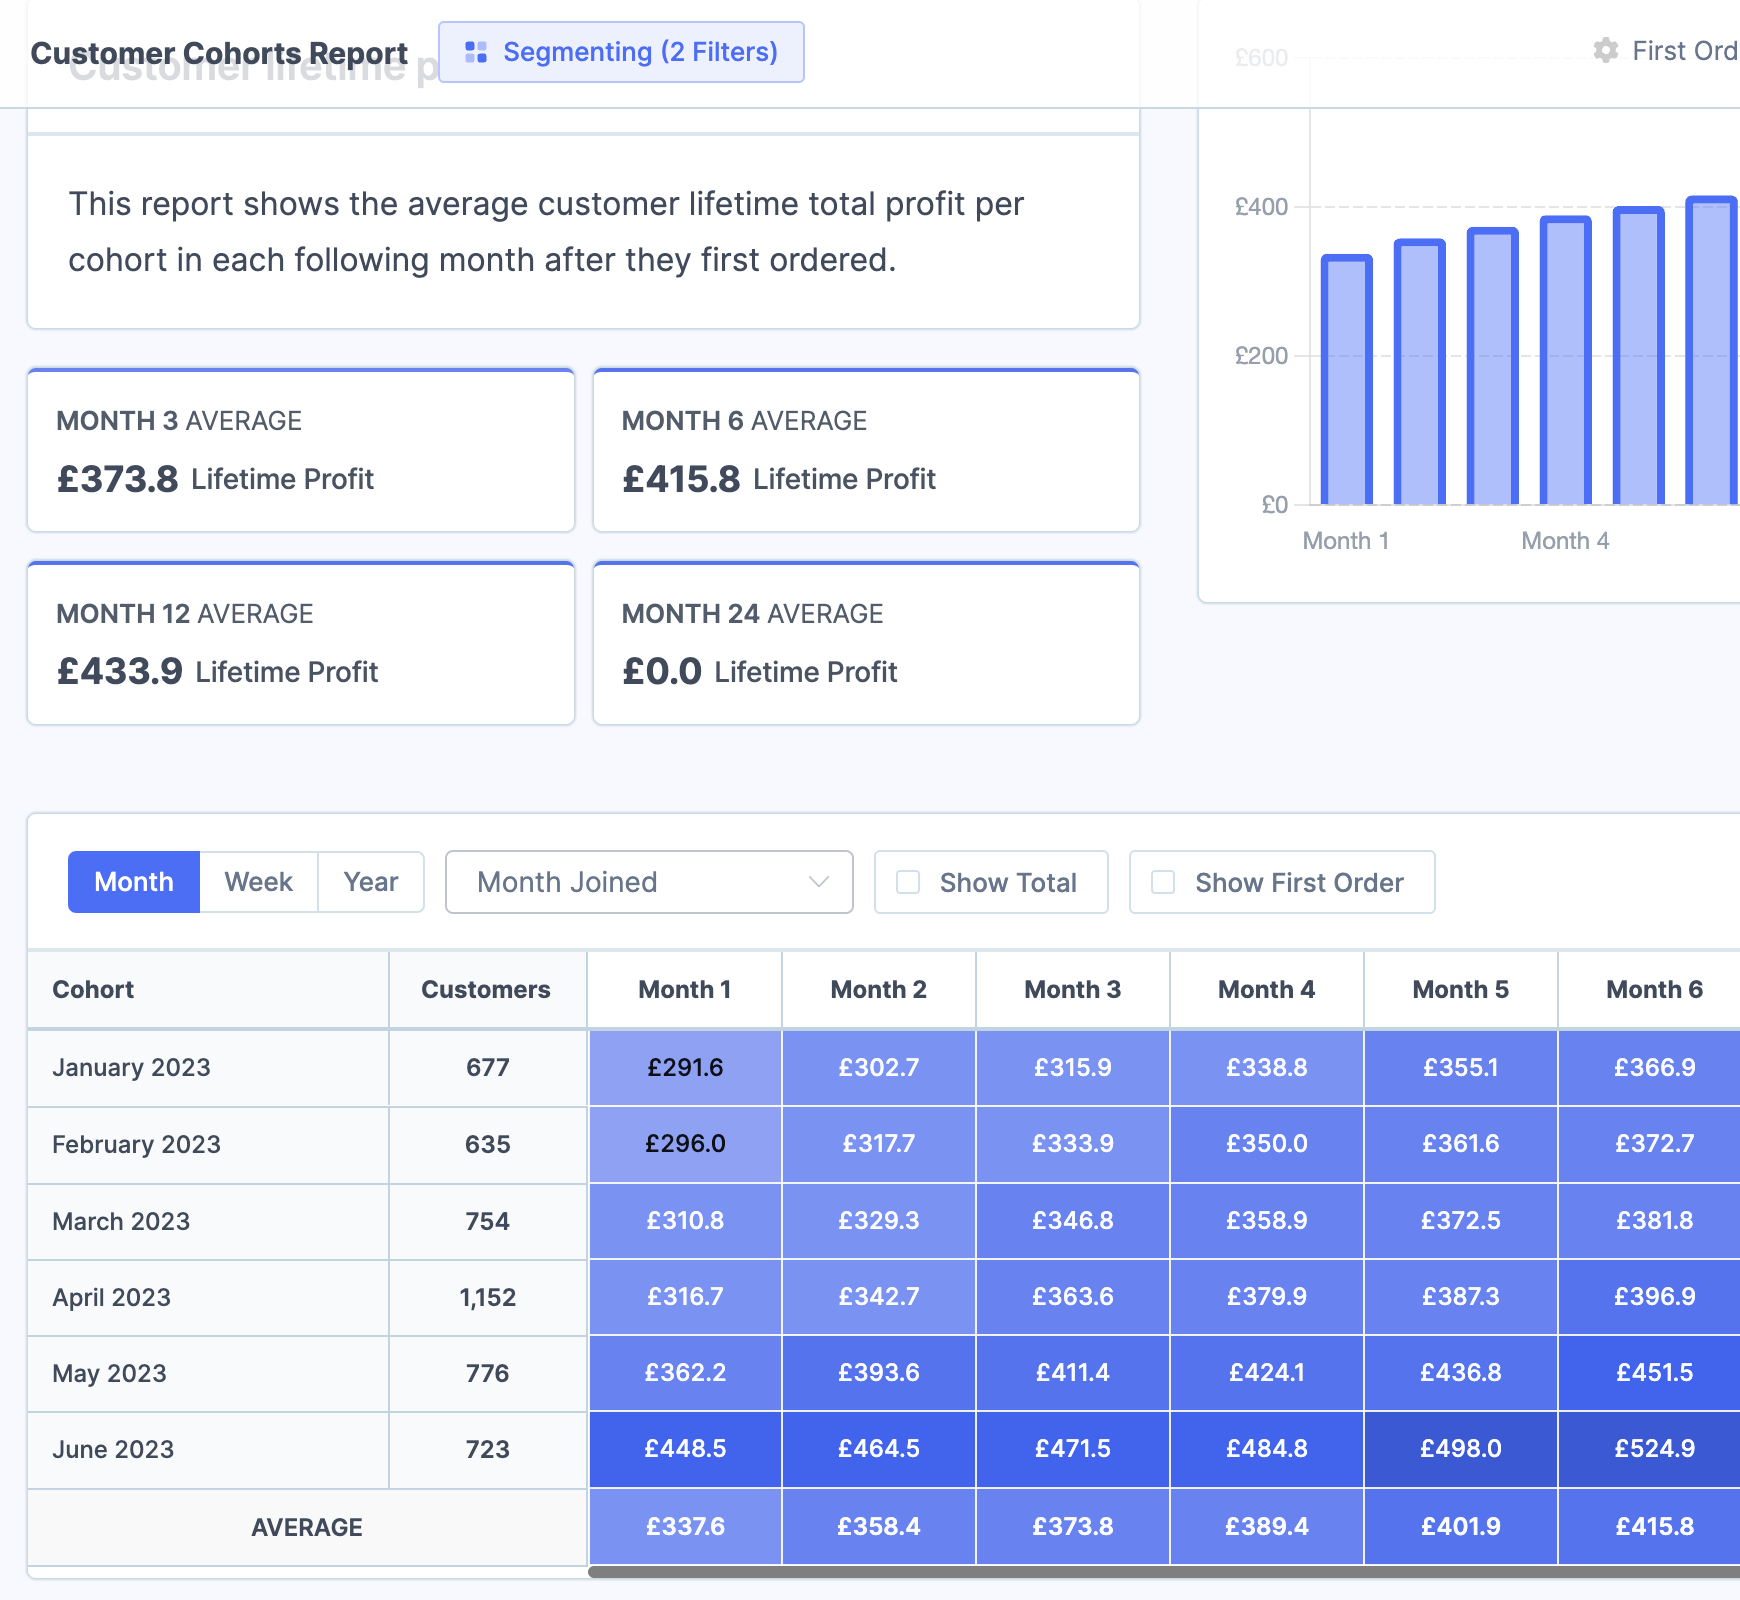
You can see that all our customers have been split into cohort groups by their join month. This then allows us to easily see how each cohorts' average profit changes from month to month over their lifetime. In this case, can see that customers who joined in June 2023, have a much higher lifetime profit than customers that joined in January 2023 in month 1.
We can also see see that the average profit has increased by month 6 in all the cohorts. This can be very helpful data when analysing the effectiveness of certain decisions; like changing prices of products, or spending money on ad campaigns.
All the other reports are presented in a similar way, for example, here is the returning customers report:
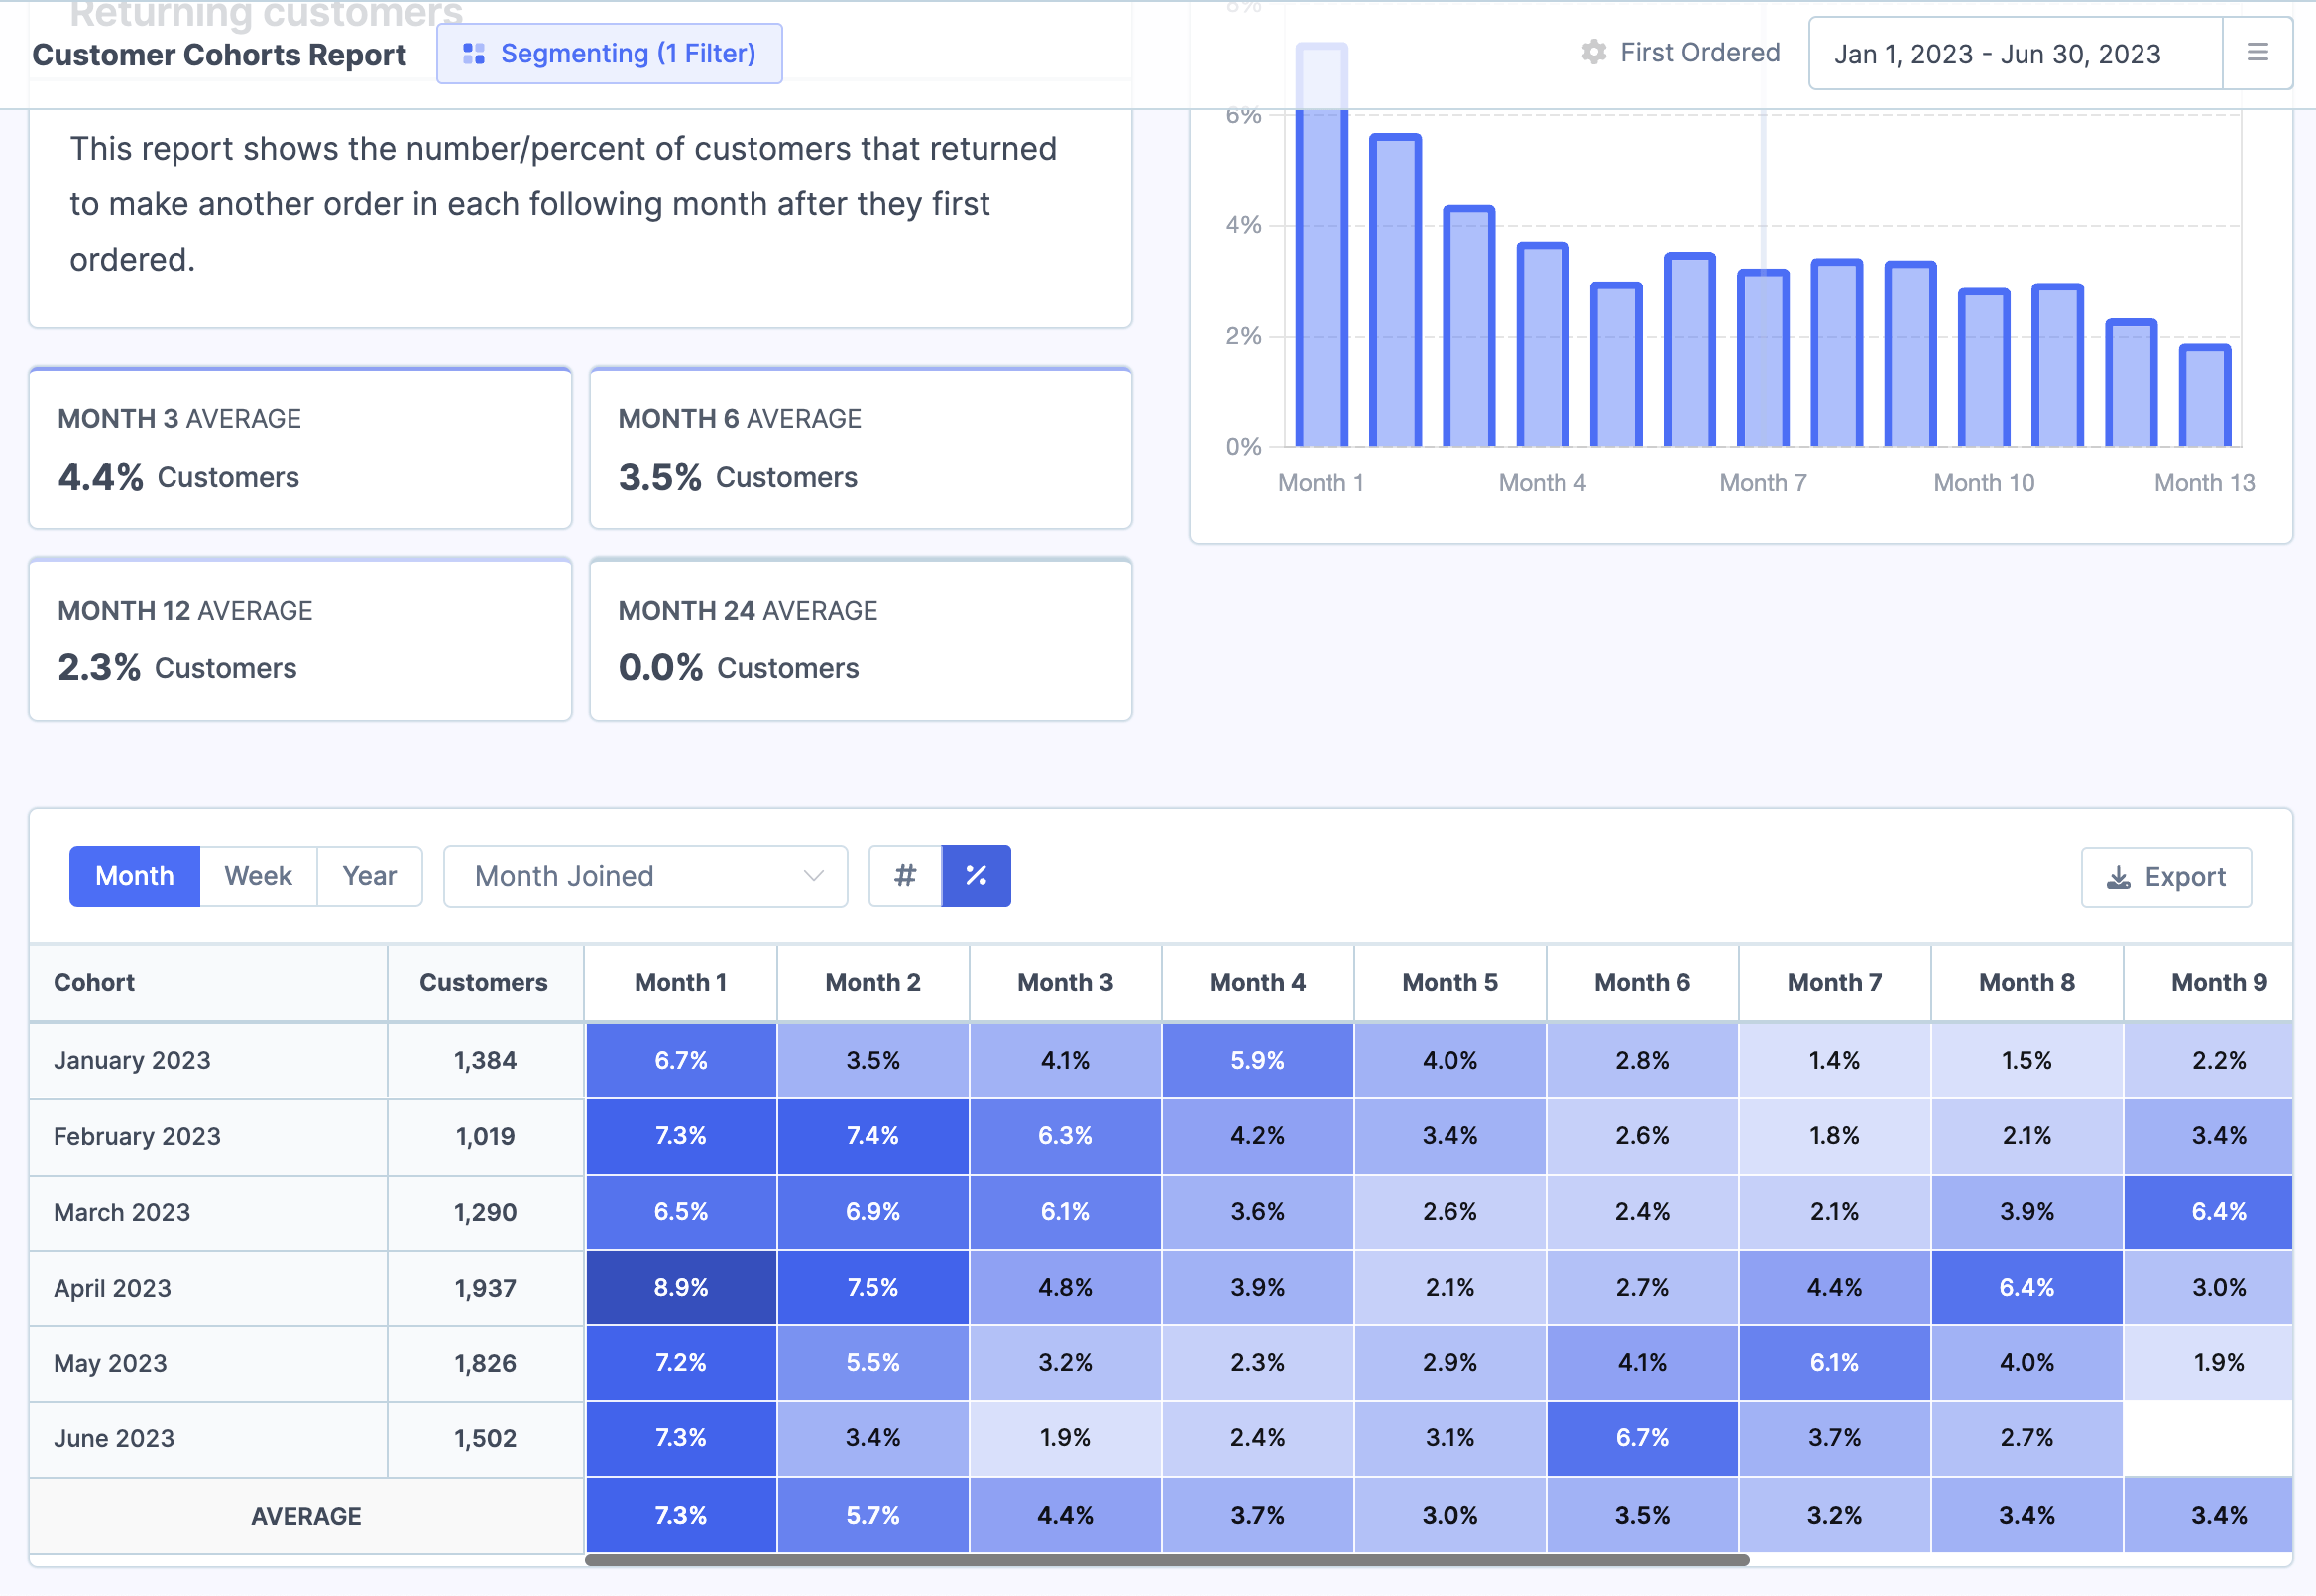
As you can see very similar, but instead of looking at lifetime profit, we are now looking at retention rate.
Each report also shows you the average of all cohorts at different points in their lifetime:
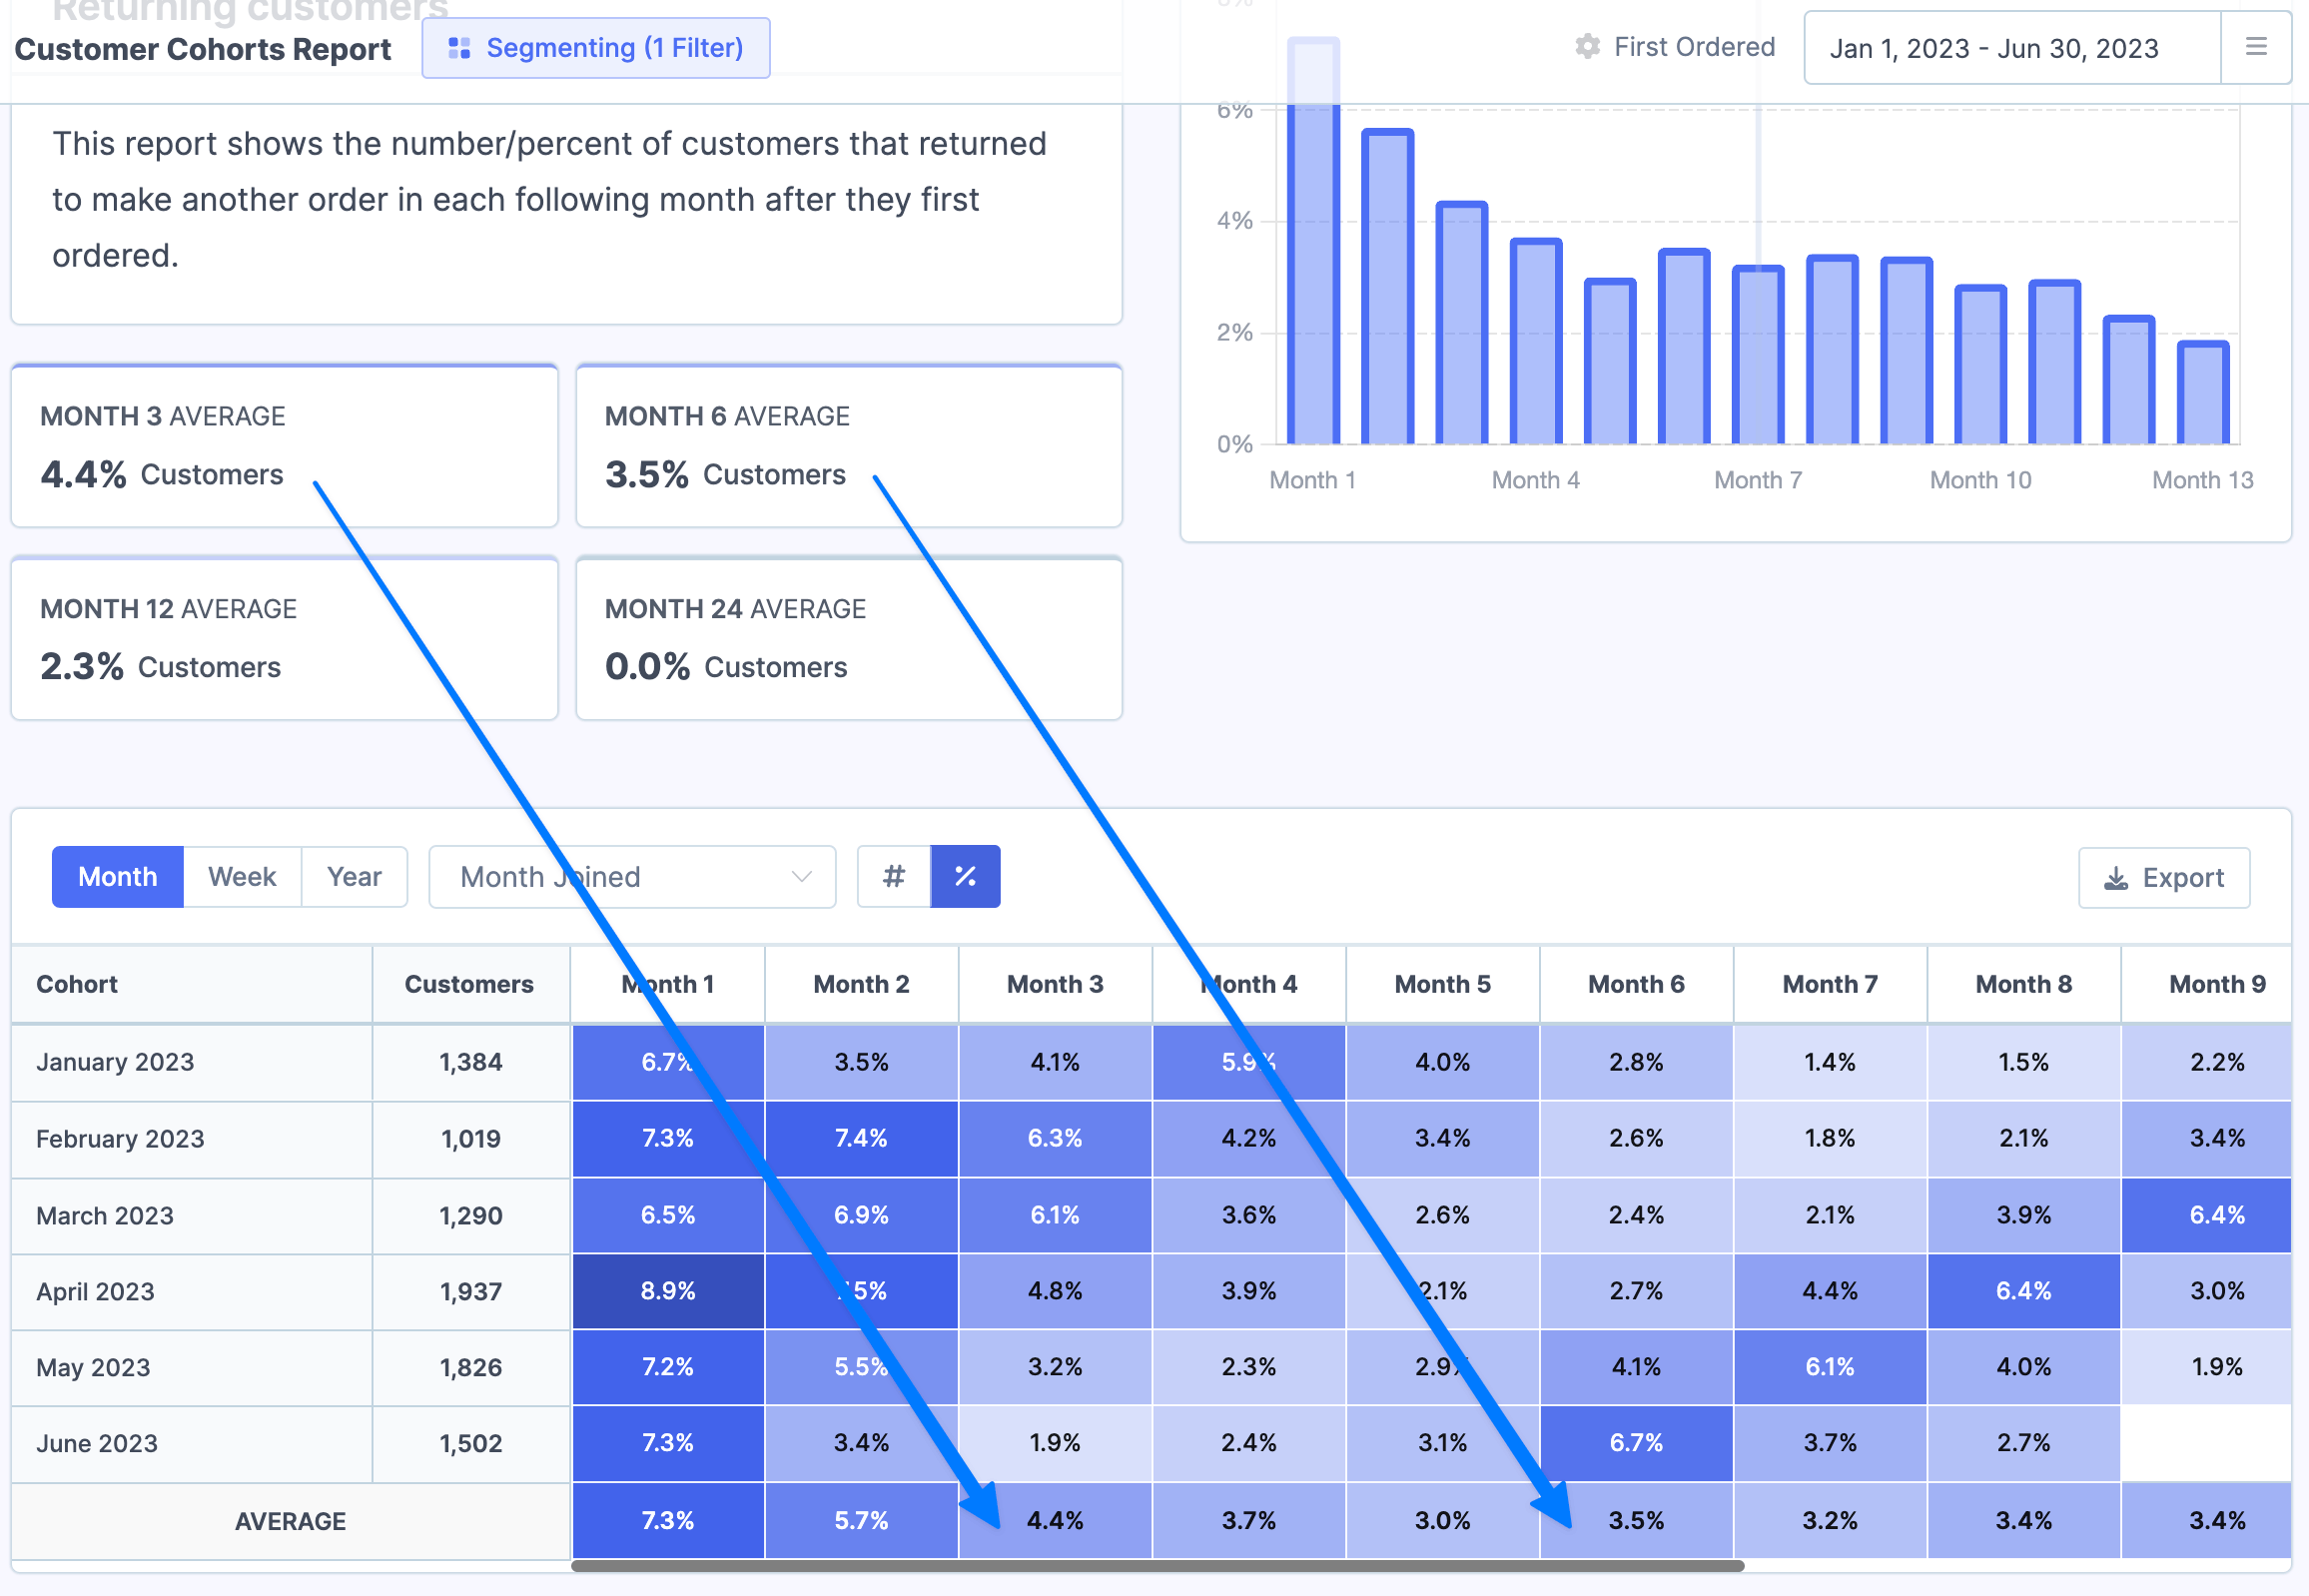
In this case, we know that in month 3, 4.4% of all our customers will make another order.
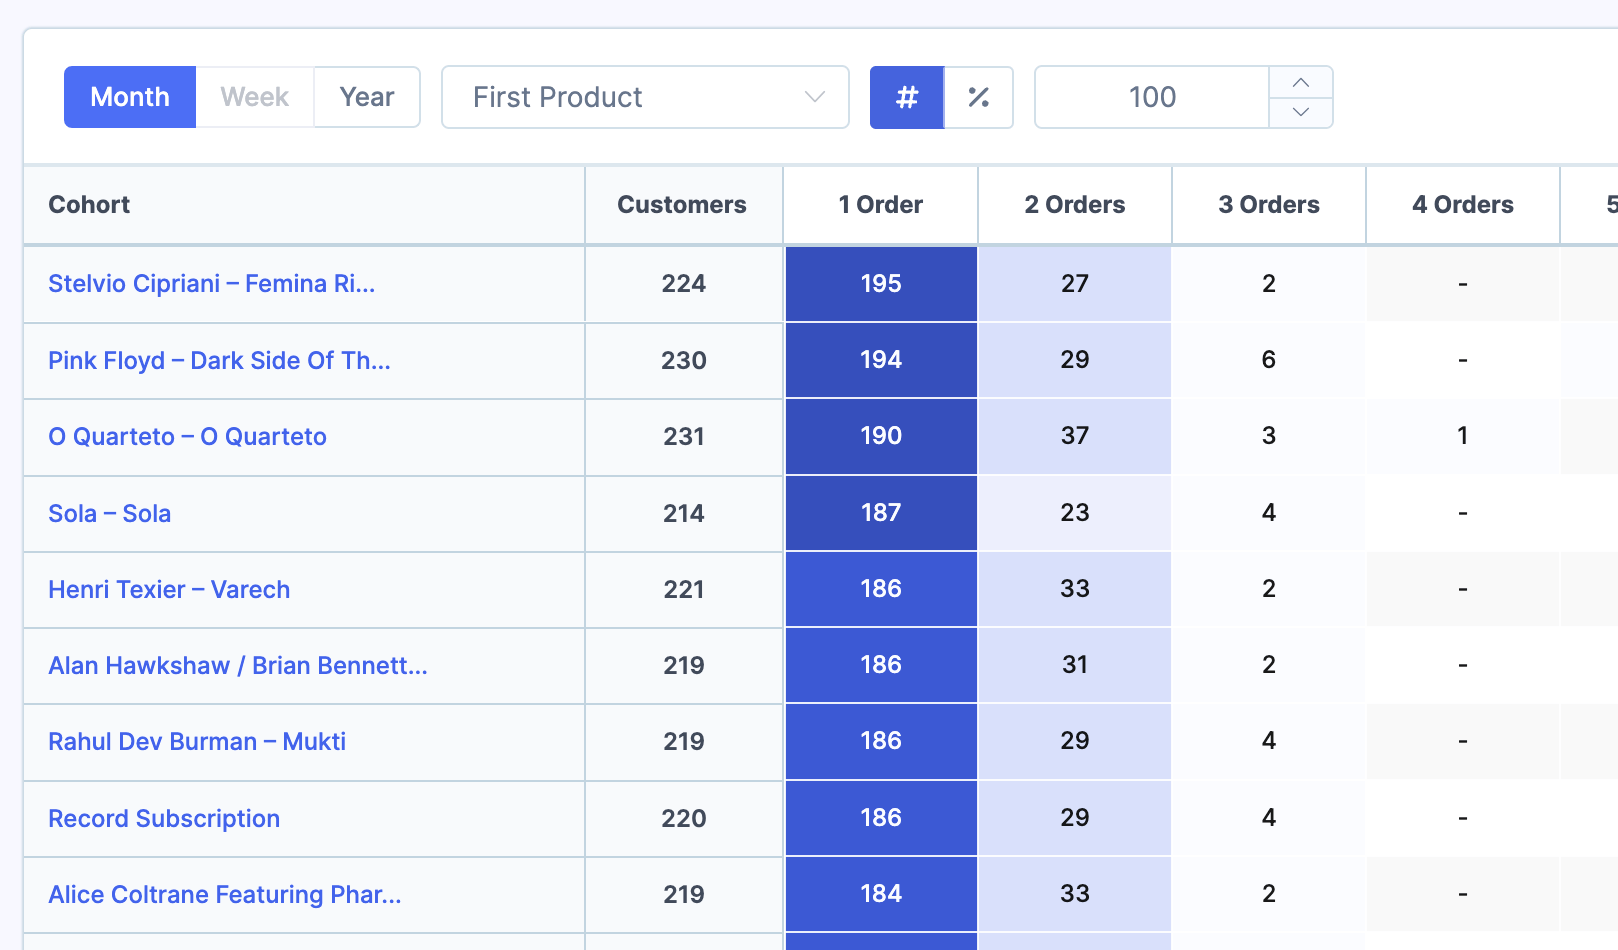
The only report which is a little different is the By order count report:
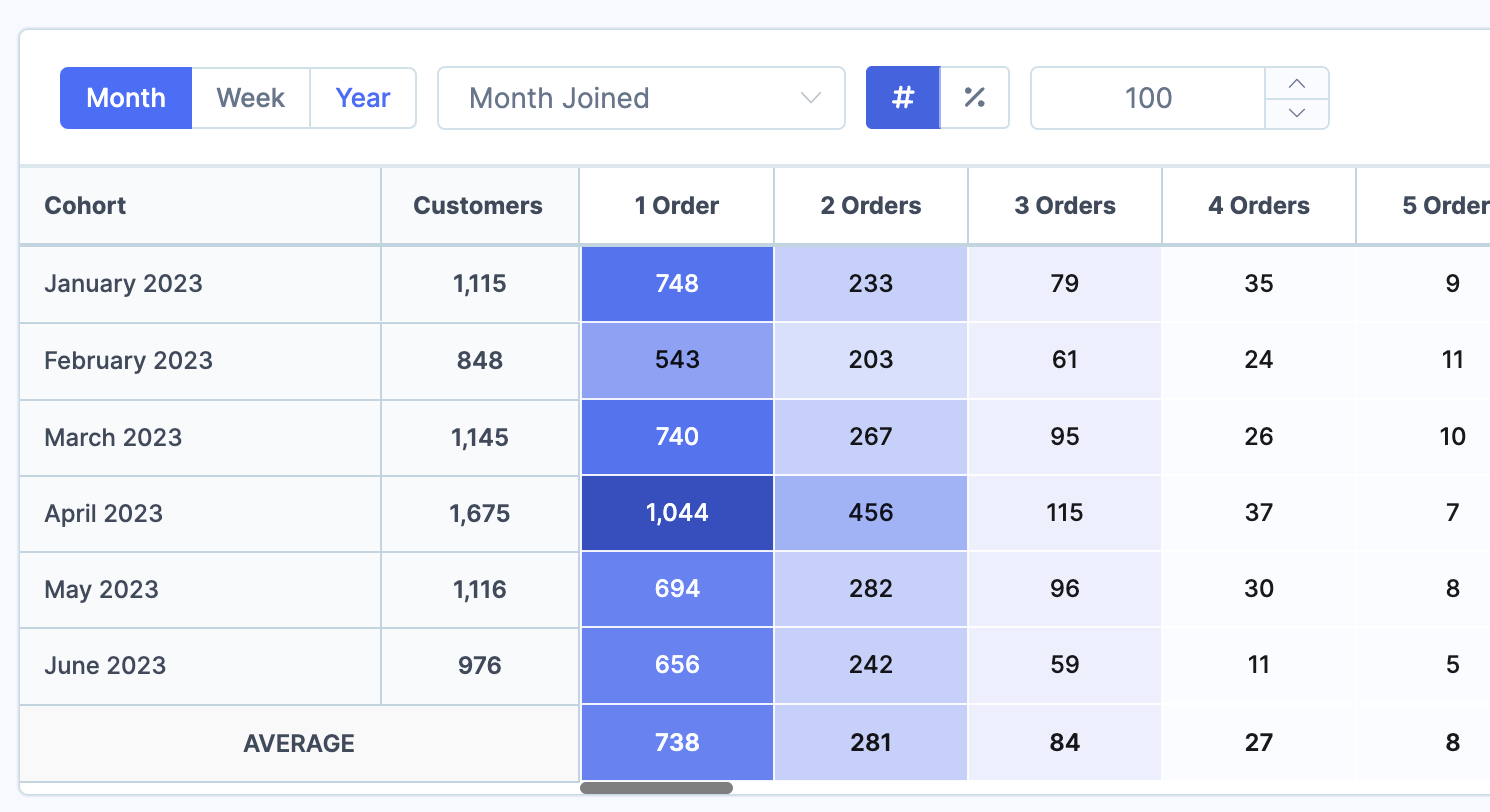
As you can see rather than showing, month 1, month 2, month 3, etc... as the column headings, it instead shows number of orders. So from this report you can see how many orders a certain cohort makes over their lifetime. So for example, you can see that the April cohort is not only bigger than all the other cohorts, but also that 456 of the customers made 2 orders over their lifetime, and 456 made 3 orders over their lifetime.
But wait, there's more
While the reports group cohorts by their join month by default, you can also group them by:
Billing Country
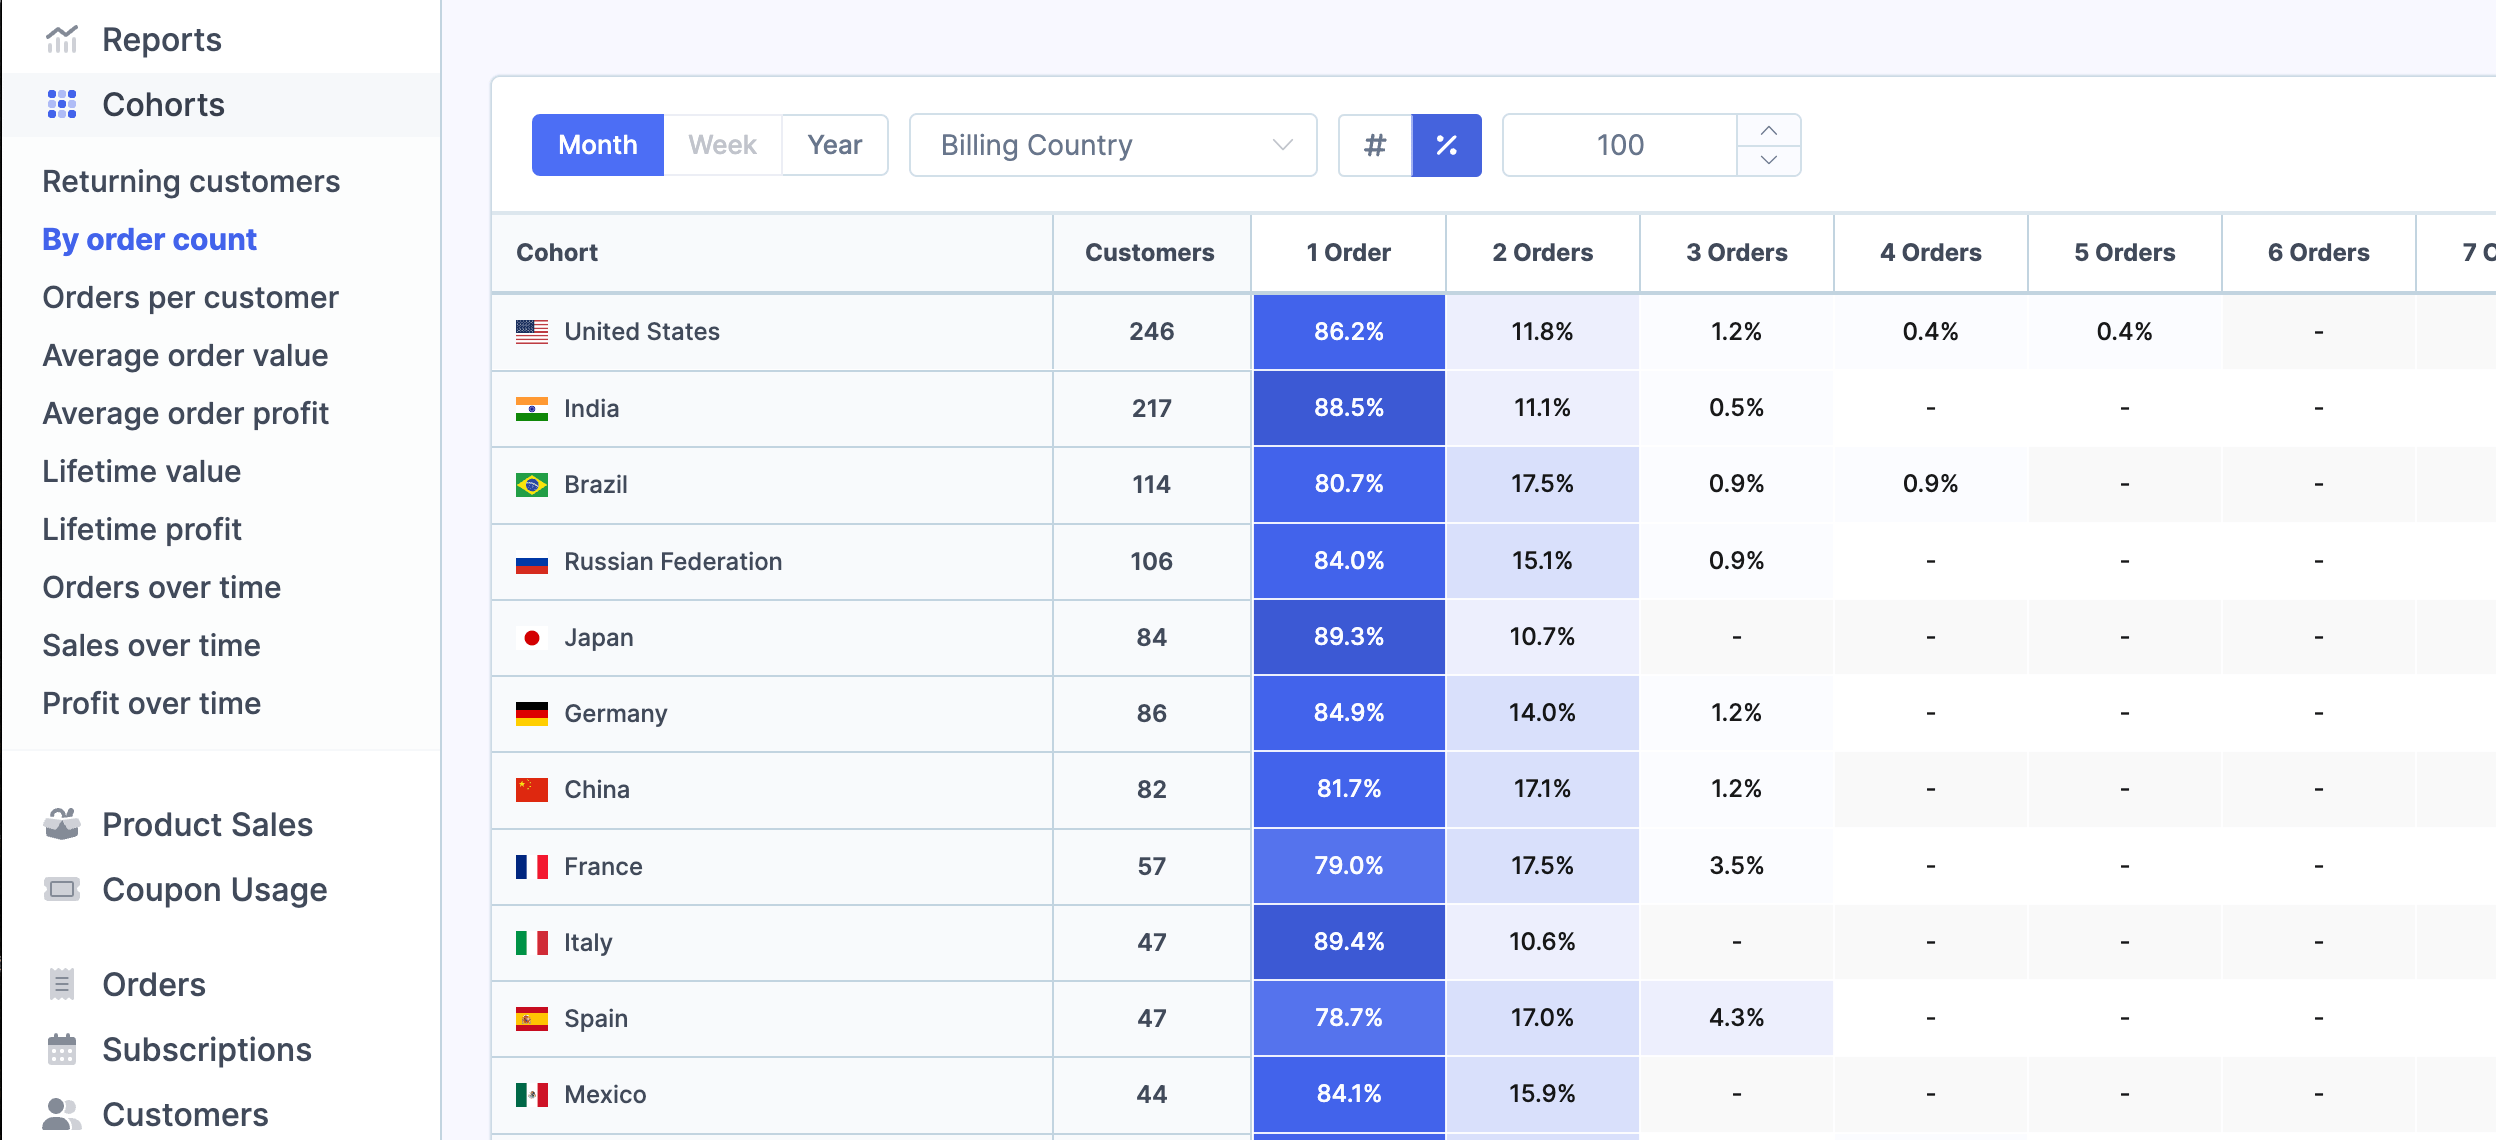
First Product Purchased
First Coupon Used
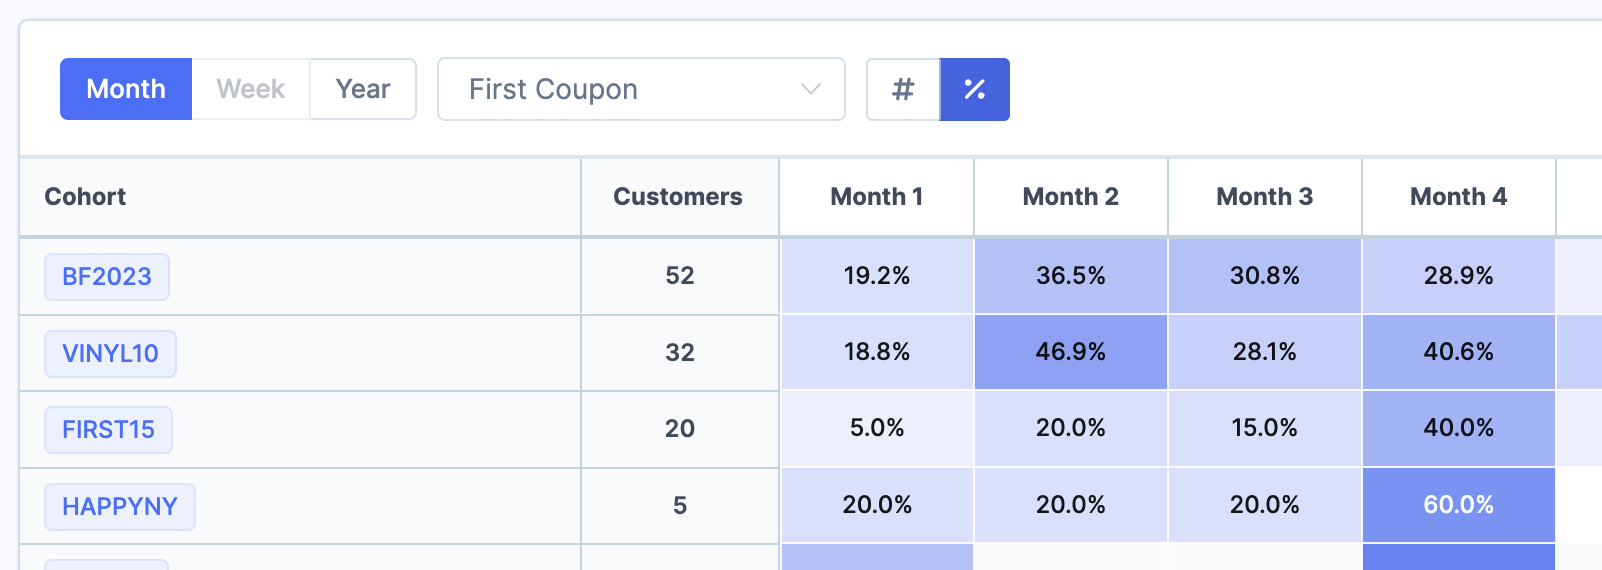
Grouping this way offers different insights. For example you can see if customers who purchase a certain product first end up with a higher retention rate. Or seeing if certain countries end up with a higher AOV or LTV.
Enter segmenting
Metorik's segmenting system that you all know and love can be used in conjunction with the cohort reports. For example, when looking at returning customers, we can filter the report to only show customers who have purchased from a certain category:
Like all reports in Metorik, the customer cohort chart can be exported as a CSV if you'd like to get the data out of Metorik.
We hope you find our new cohorts reports useful! We're excited to see the use cases you have for it and continue to improve our tools for customer analysis.