
In 2024 we released the first ever Metorik Insights for WooCommerce report, analyzing data from thousands of real Woo stores. The response from the community was overwhelming, and two requests kept coming up: show us how things are changing over time, and break the data down by store size.
So we did both. The 2026 edition of the Metorik Insights for WooCommerce report is built from over 65 million orders totaling more than $6.6 billion in revenue, from a randomized sample of 6,000+ WooCommerce stores. This isn't survey data or opinion. It's what stores actually did in 2025, drawn from anonymized, aggregated data tracked by Metorik, and this time, we’ve broken things down by store size, and provided year-over-year comparisons.
The full report is 34 pages of insights covering everything from order patterns and customer behavior to subscriptions, globalization, payment gateways, and the WooCommerce plugin ecosystem. You can download it for free here.
But first, here are seven findings that stood out to us the most.
Key takeaways
The average WooCommerce order value is $105, but drops 18% on weekends
72% of WooCommerce orders are now placed on mobile, but desktop AOV is 2.3x higher
Returning customers spend significantly more at the typical store, with pet supplies seeing a 42% uplift
74% of WooCommerce orders now include free shipping, up from 65% in 2023
Customers 1,000-5,000km away spend roughly 2x more than local buyers
WooCommerce refund rates have nearly halved, from 2.4% in 2023 to 1.4% in 2025
The average WooCommerce store runs 58 plugins, unchanged since 2023
About the data
Every metric in this report is calculated from anonymized, aggregated data across a randomized sample of over 6,000 WooCommerce stores using Metorik. No individual store names, URLs, or customer information is included. All published figures are aggregates (medians, weighted averages, or distributions) to ensure no single store's performance can be identified. Stores are screened for outliers across six key metrics, and industry breakdowns require a minimum of 50 stores.
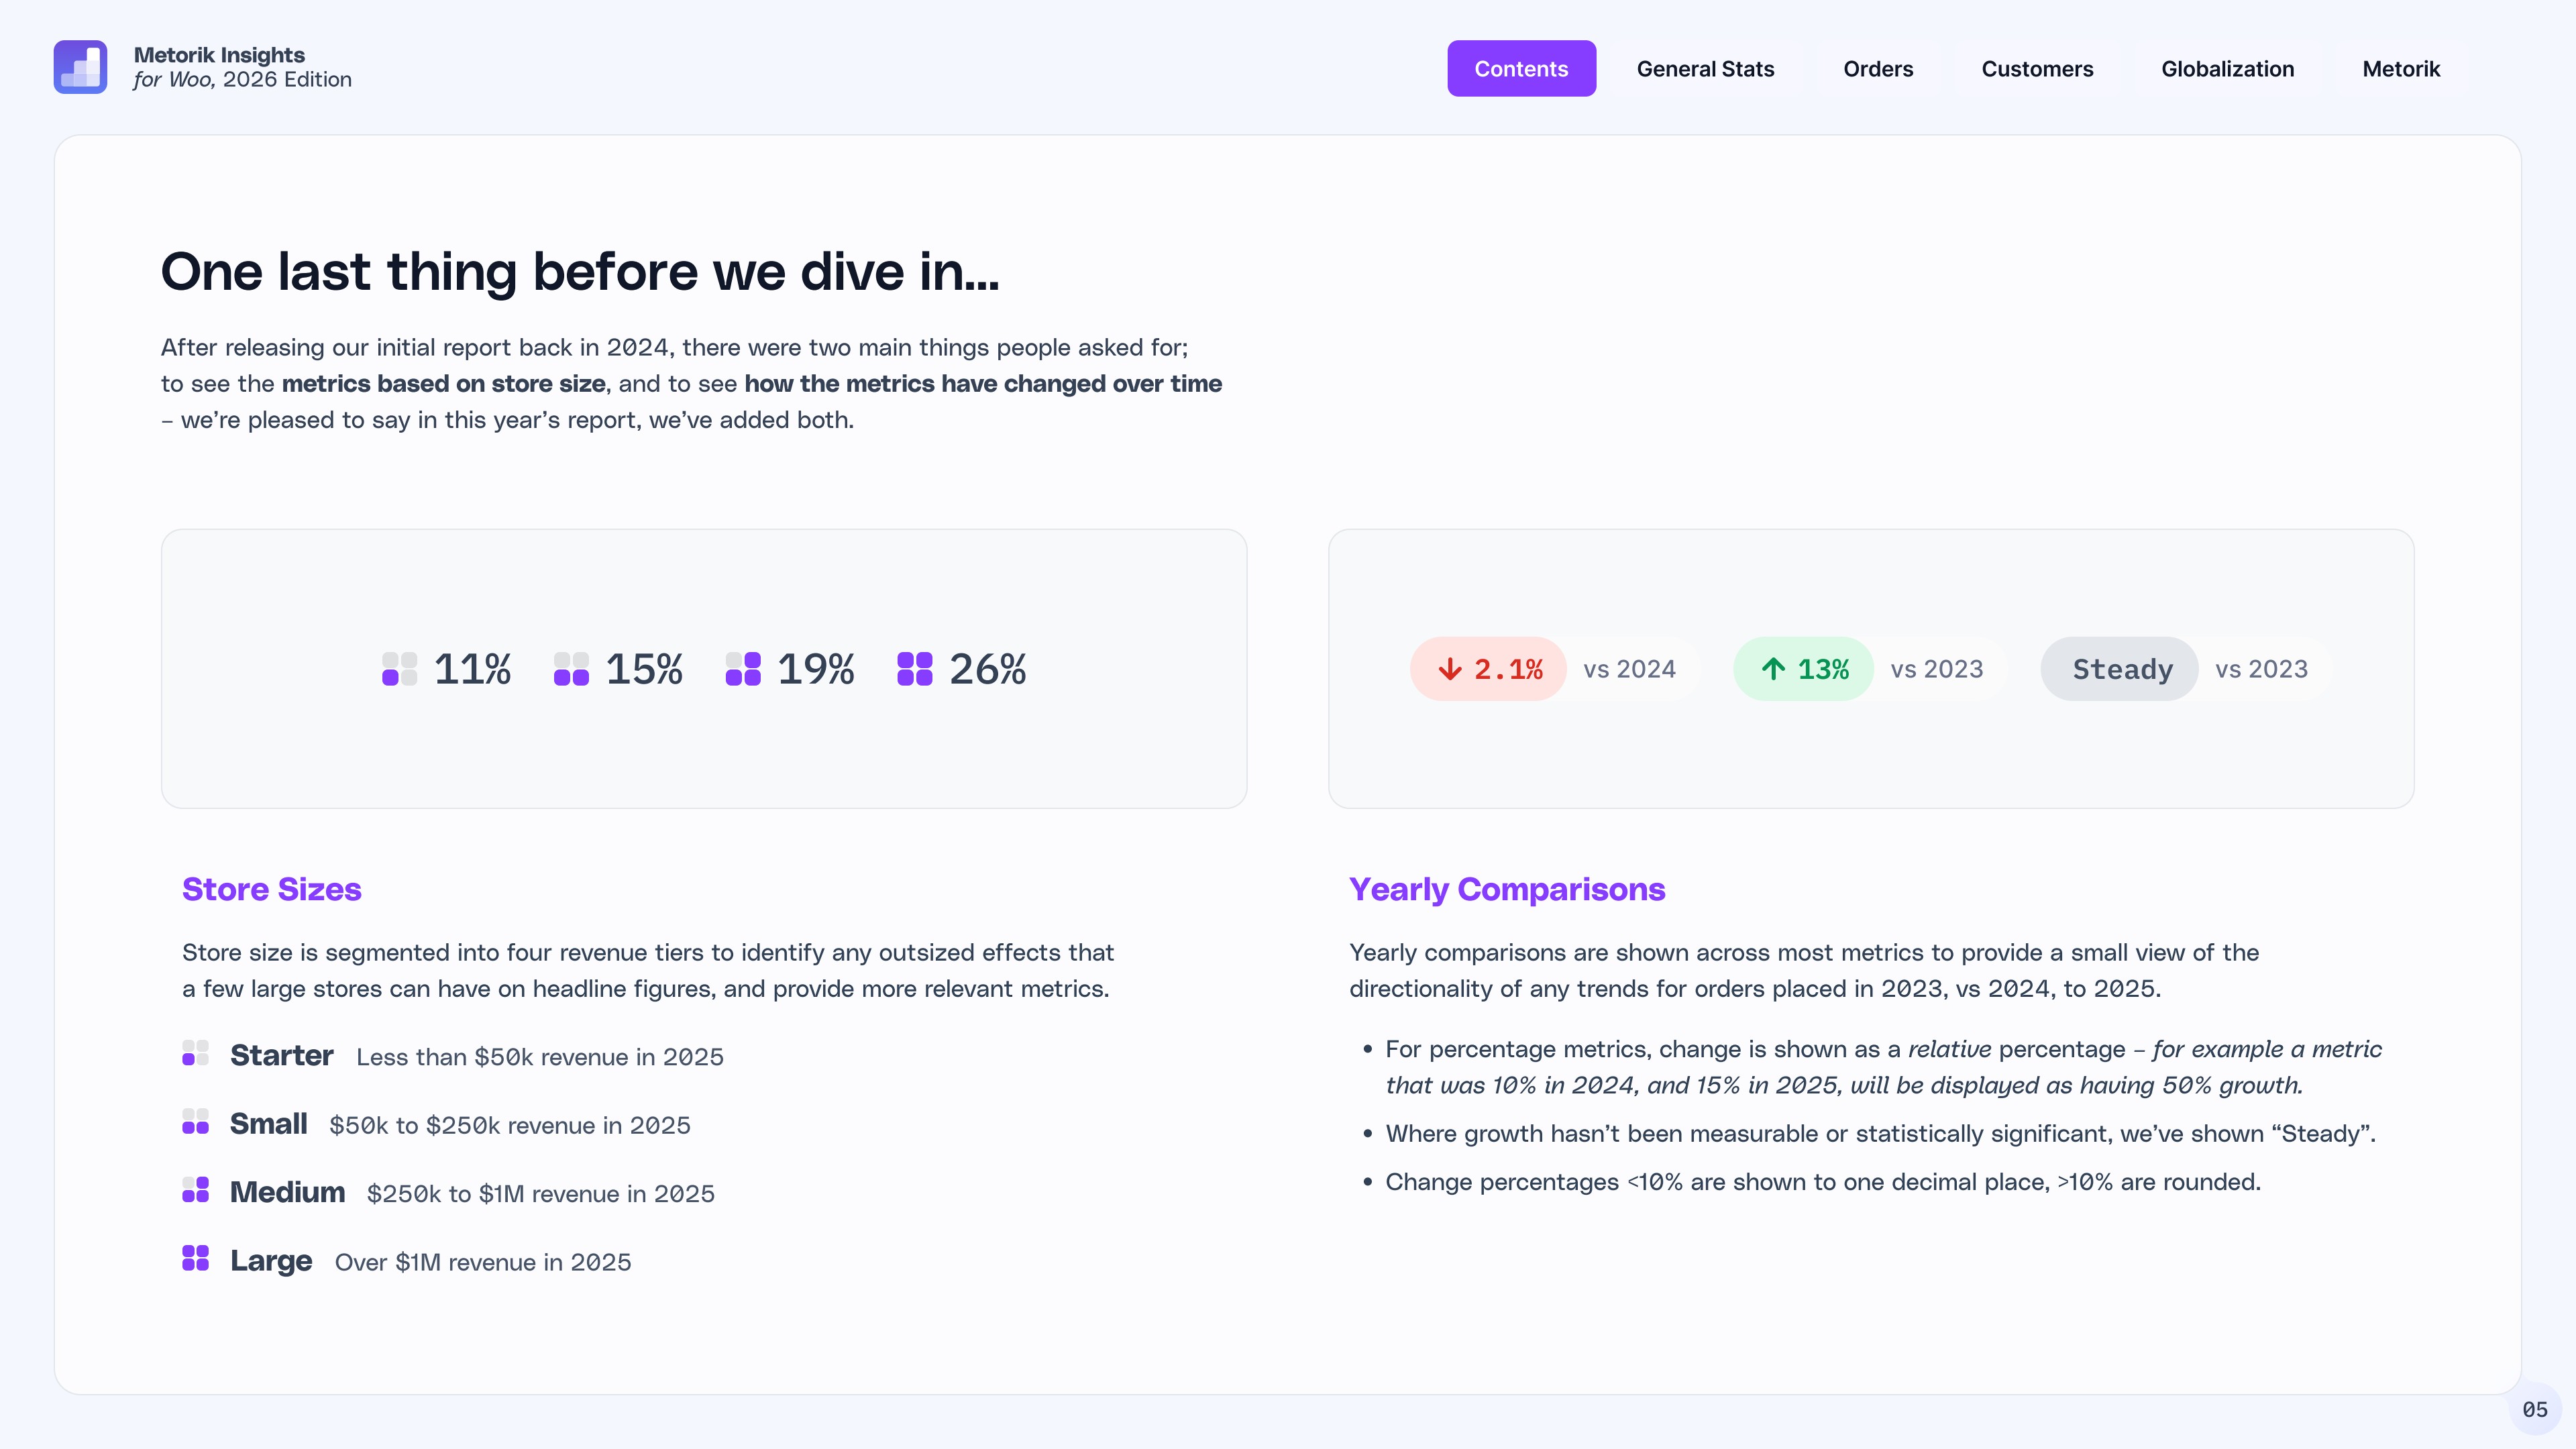
New in this year's edition, every metric is now broken down by store size and includes year-over-year comparisons. Store size is segmented into four revenue tiers: Starter (under $50k), Small ($50k-$250k), Medium ($250k-$1M), and Large (over $1M). This segmentation helps isolate the outsized effects that a few large stores can have on headline figures, and provides more relevant benchmarks for merchants at every stage of growth. Yearly comparisons track how each metric has shifted from 2023, to 2024, to 2025, so you can see the direction of trends, not just a single snapshot.
1. Your customers spend $30 less on weekends
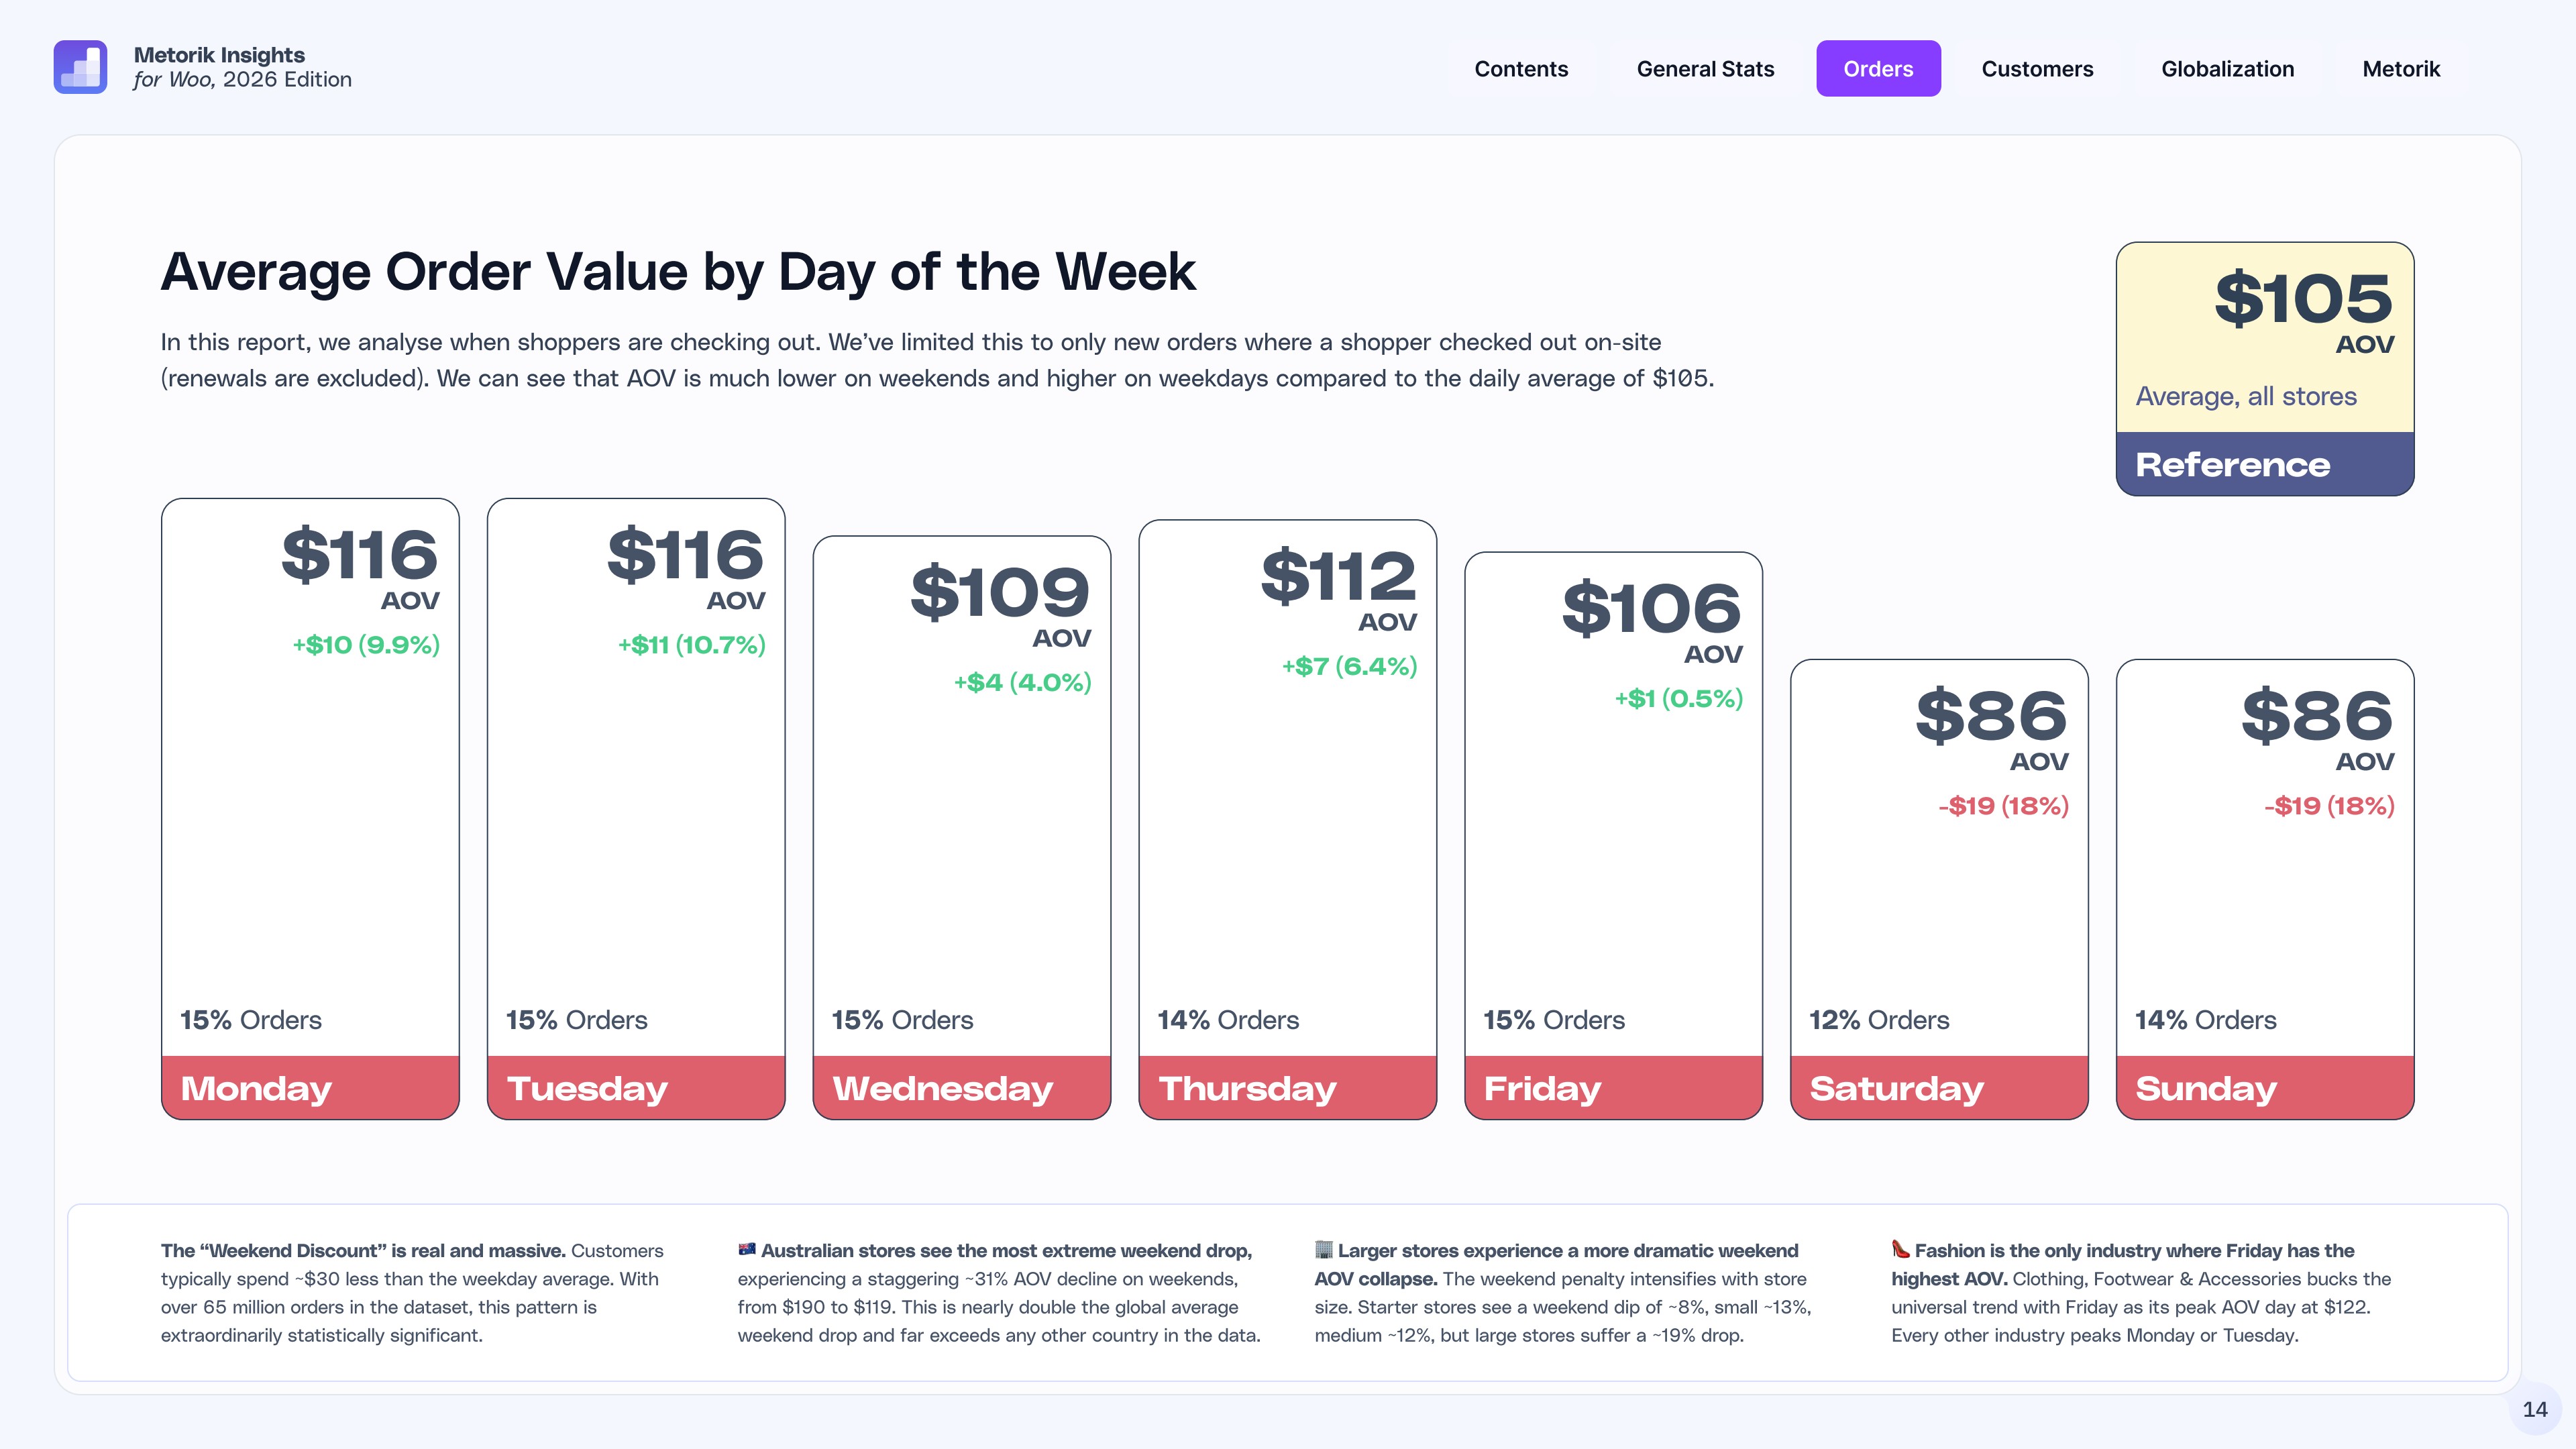
What is the average WooCommerce order value? In 2025, it was $105. But that number hides a dramatic weekly rhythm.
On weekdays, AOV peaks at $116 on Tuesdays. On weekends, it drops to $86 on both Saturday and Sunday, an 18% decline. That's roughly $30 less per order, every weekend, across 65 million orders. The statistical significance is enormous.
Some markets feel it even harder. Australian WooCommerce stores see a staggering 31% weekend AOV drop, from $190 to $119, nearly double the global average decline. The effect intensifies with store size too: starter stores see an 8% dip, while large stores suffer a 19% weekend penalty.
What to do with this: If you're running promotions for high-value products, schedule them for Tuesday or Wednesday. Consider testing weekend-specific bundles or lower-priced offers designed to match the browsing mindset of Saturday and Sunday shoppers. Metorik's analytics and reporting tools let you break down your own AOV by day of week so you can see how your store compares.
2. Mobile won the order count. Desktop still wins the wallet.
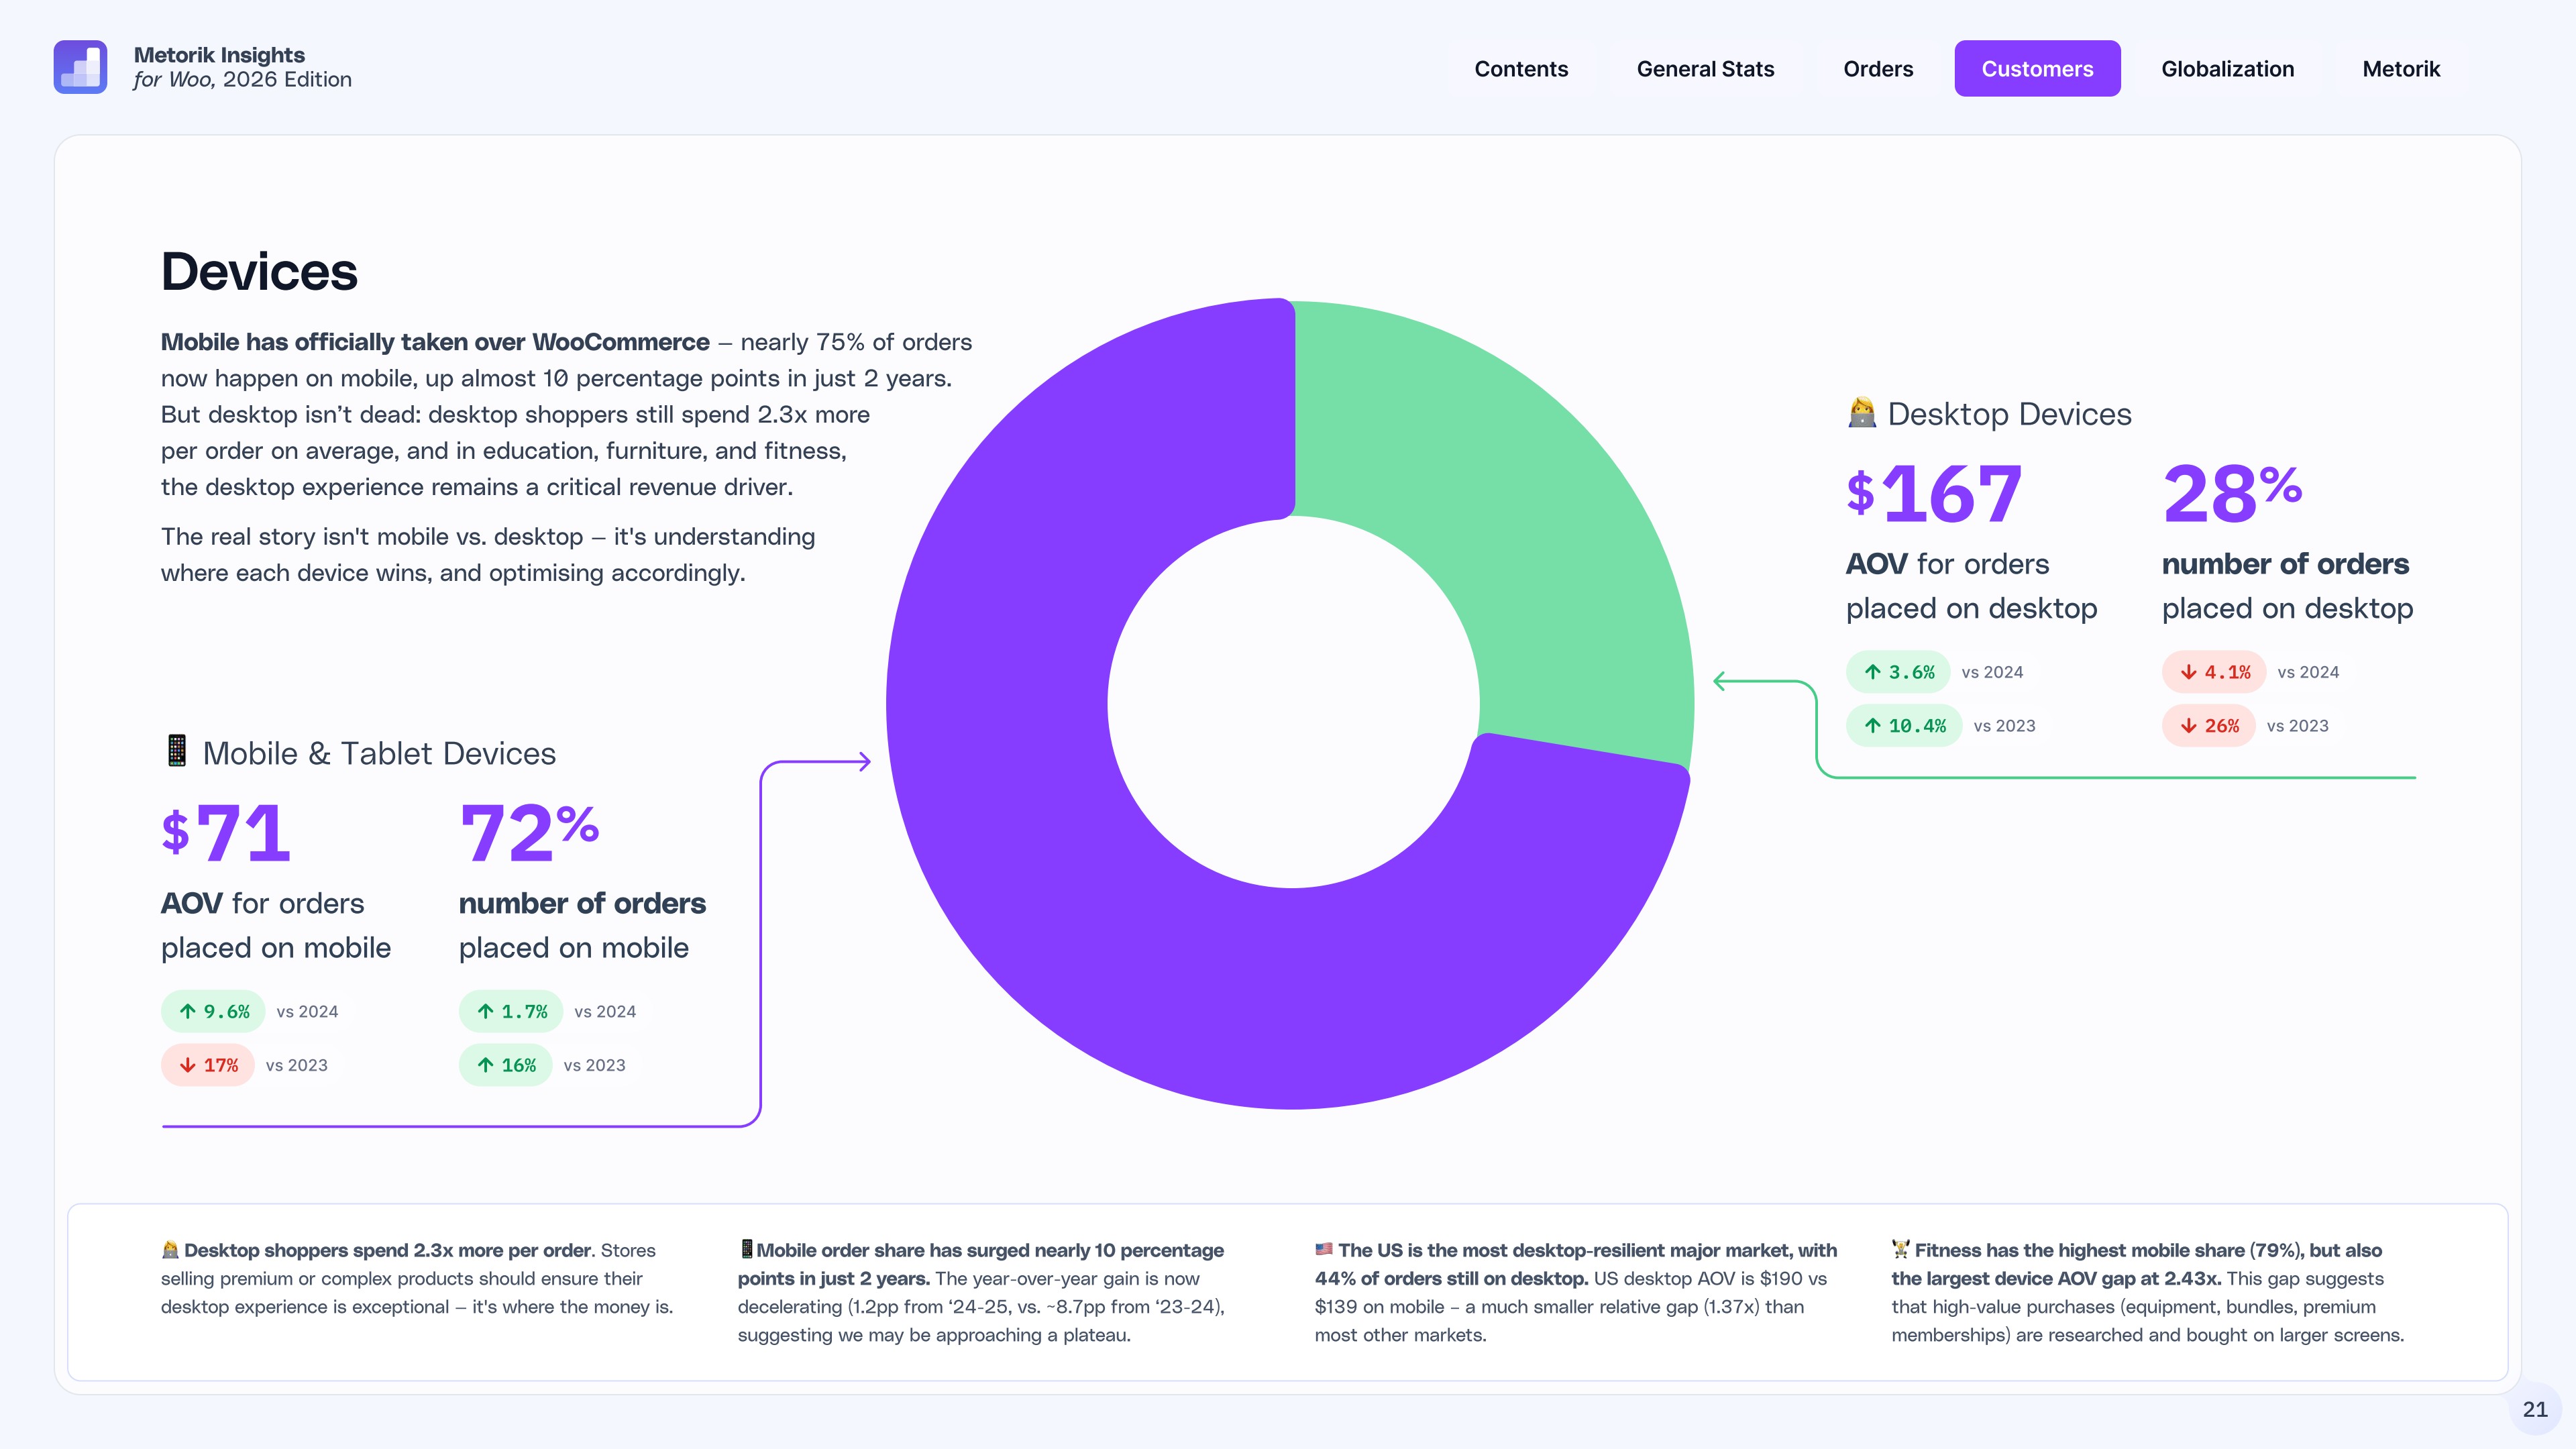
How many WooCommerce orders are placed on mobile? Mobile has officially taken over. Nearly 72% of all orders now happen on phones and tablets, up almost 10 percentage points in just two years.
But here's the nuance everyone misses: desktop shoppers still spend 2.3x more per order. The average desktop AOV is $167 compared to just $71 on mobile. That gap has widened since last year.
The fitness industry shows the most extreme split. 79% of orders are mobile, but the desktop AOV gap is a massive 2.43x. This suggests high-value purchases like equipment, bundles, and premium memberships are still researched and bought on larger screens.
Interestingly, the US remains the most desktop-resilient major market with 44% of orders still placed on desktop, and a much smaller relative AOV gap (1.37x).
What to do with this: Mobile-first is table stakes now. But if you're selling anything above $100, your desktop experience is where the money is. Don't let it become an afterthought.
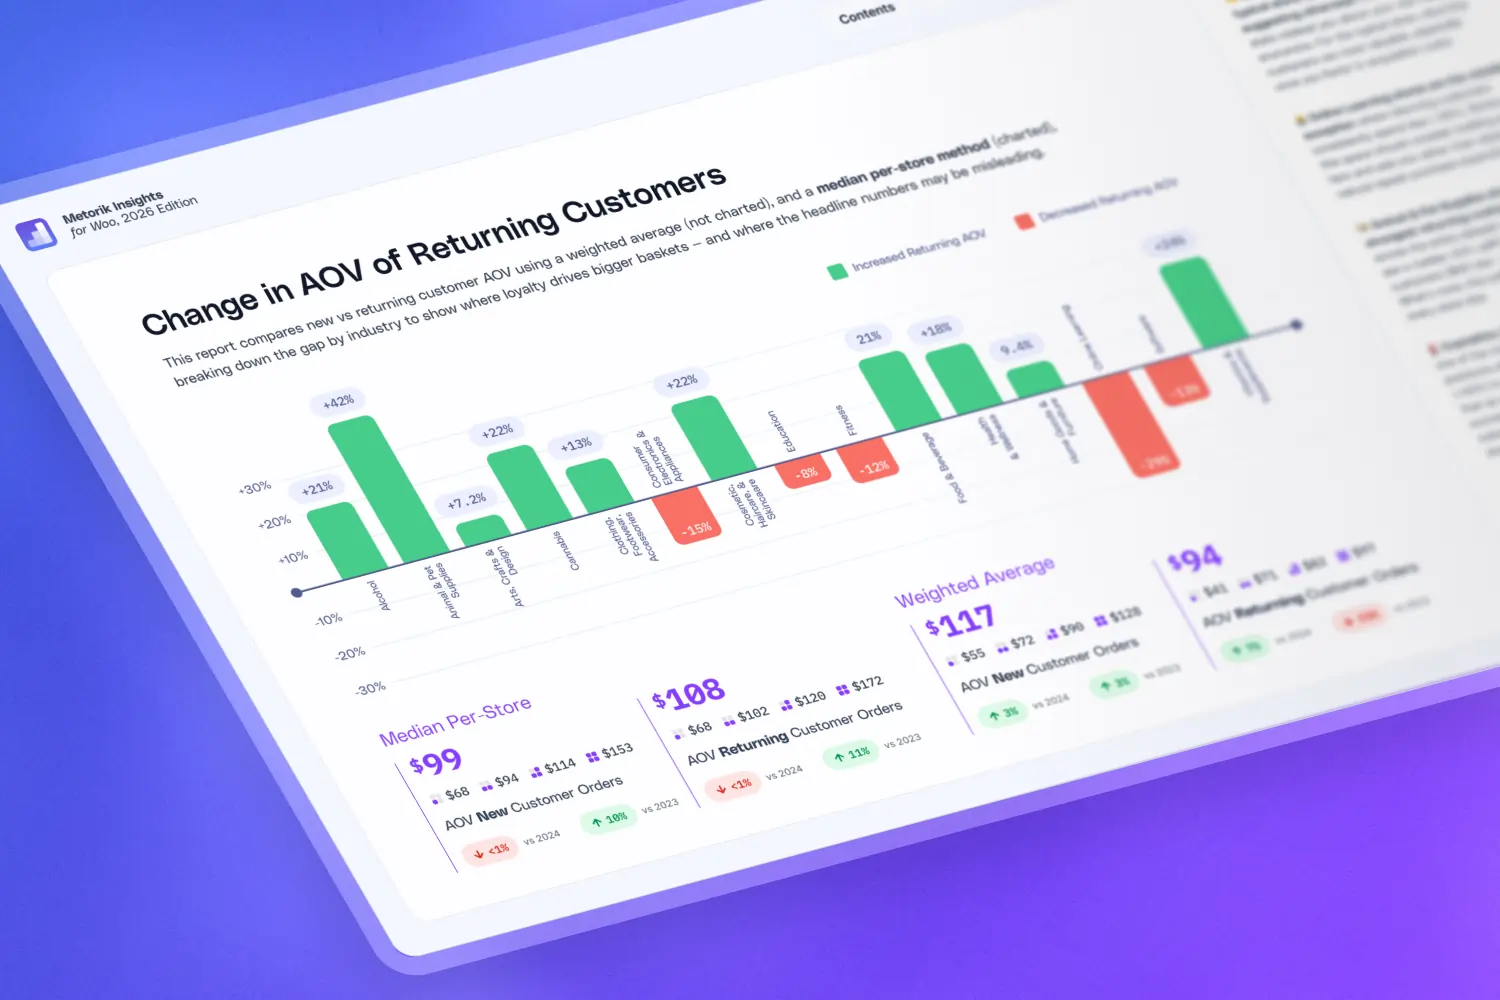
3. Returning customers are worth more than you think
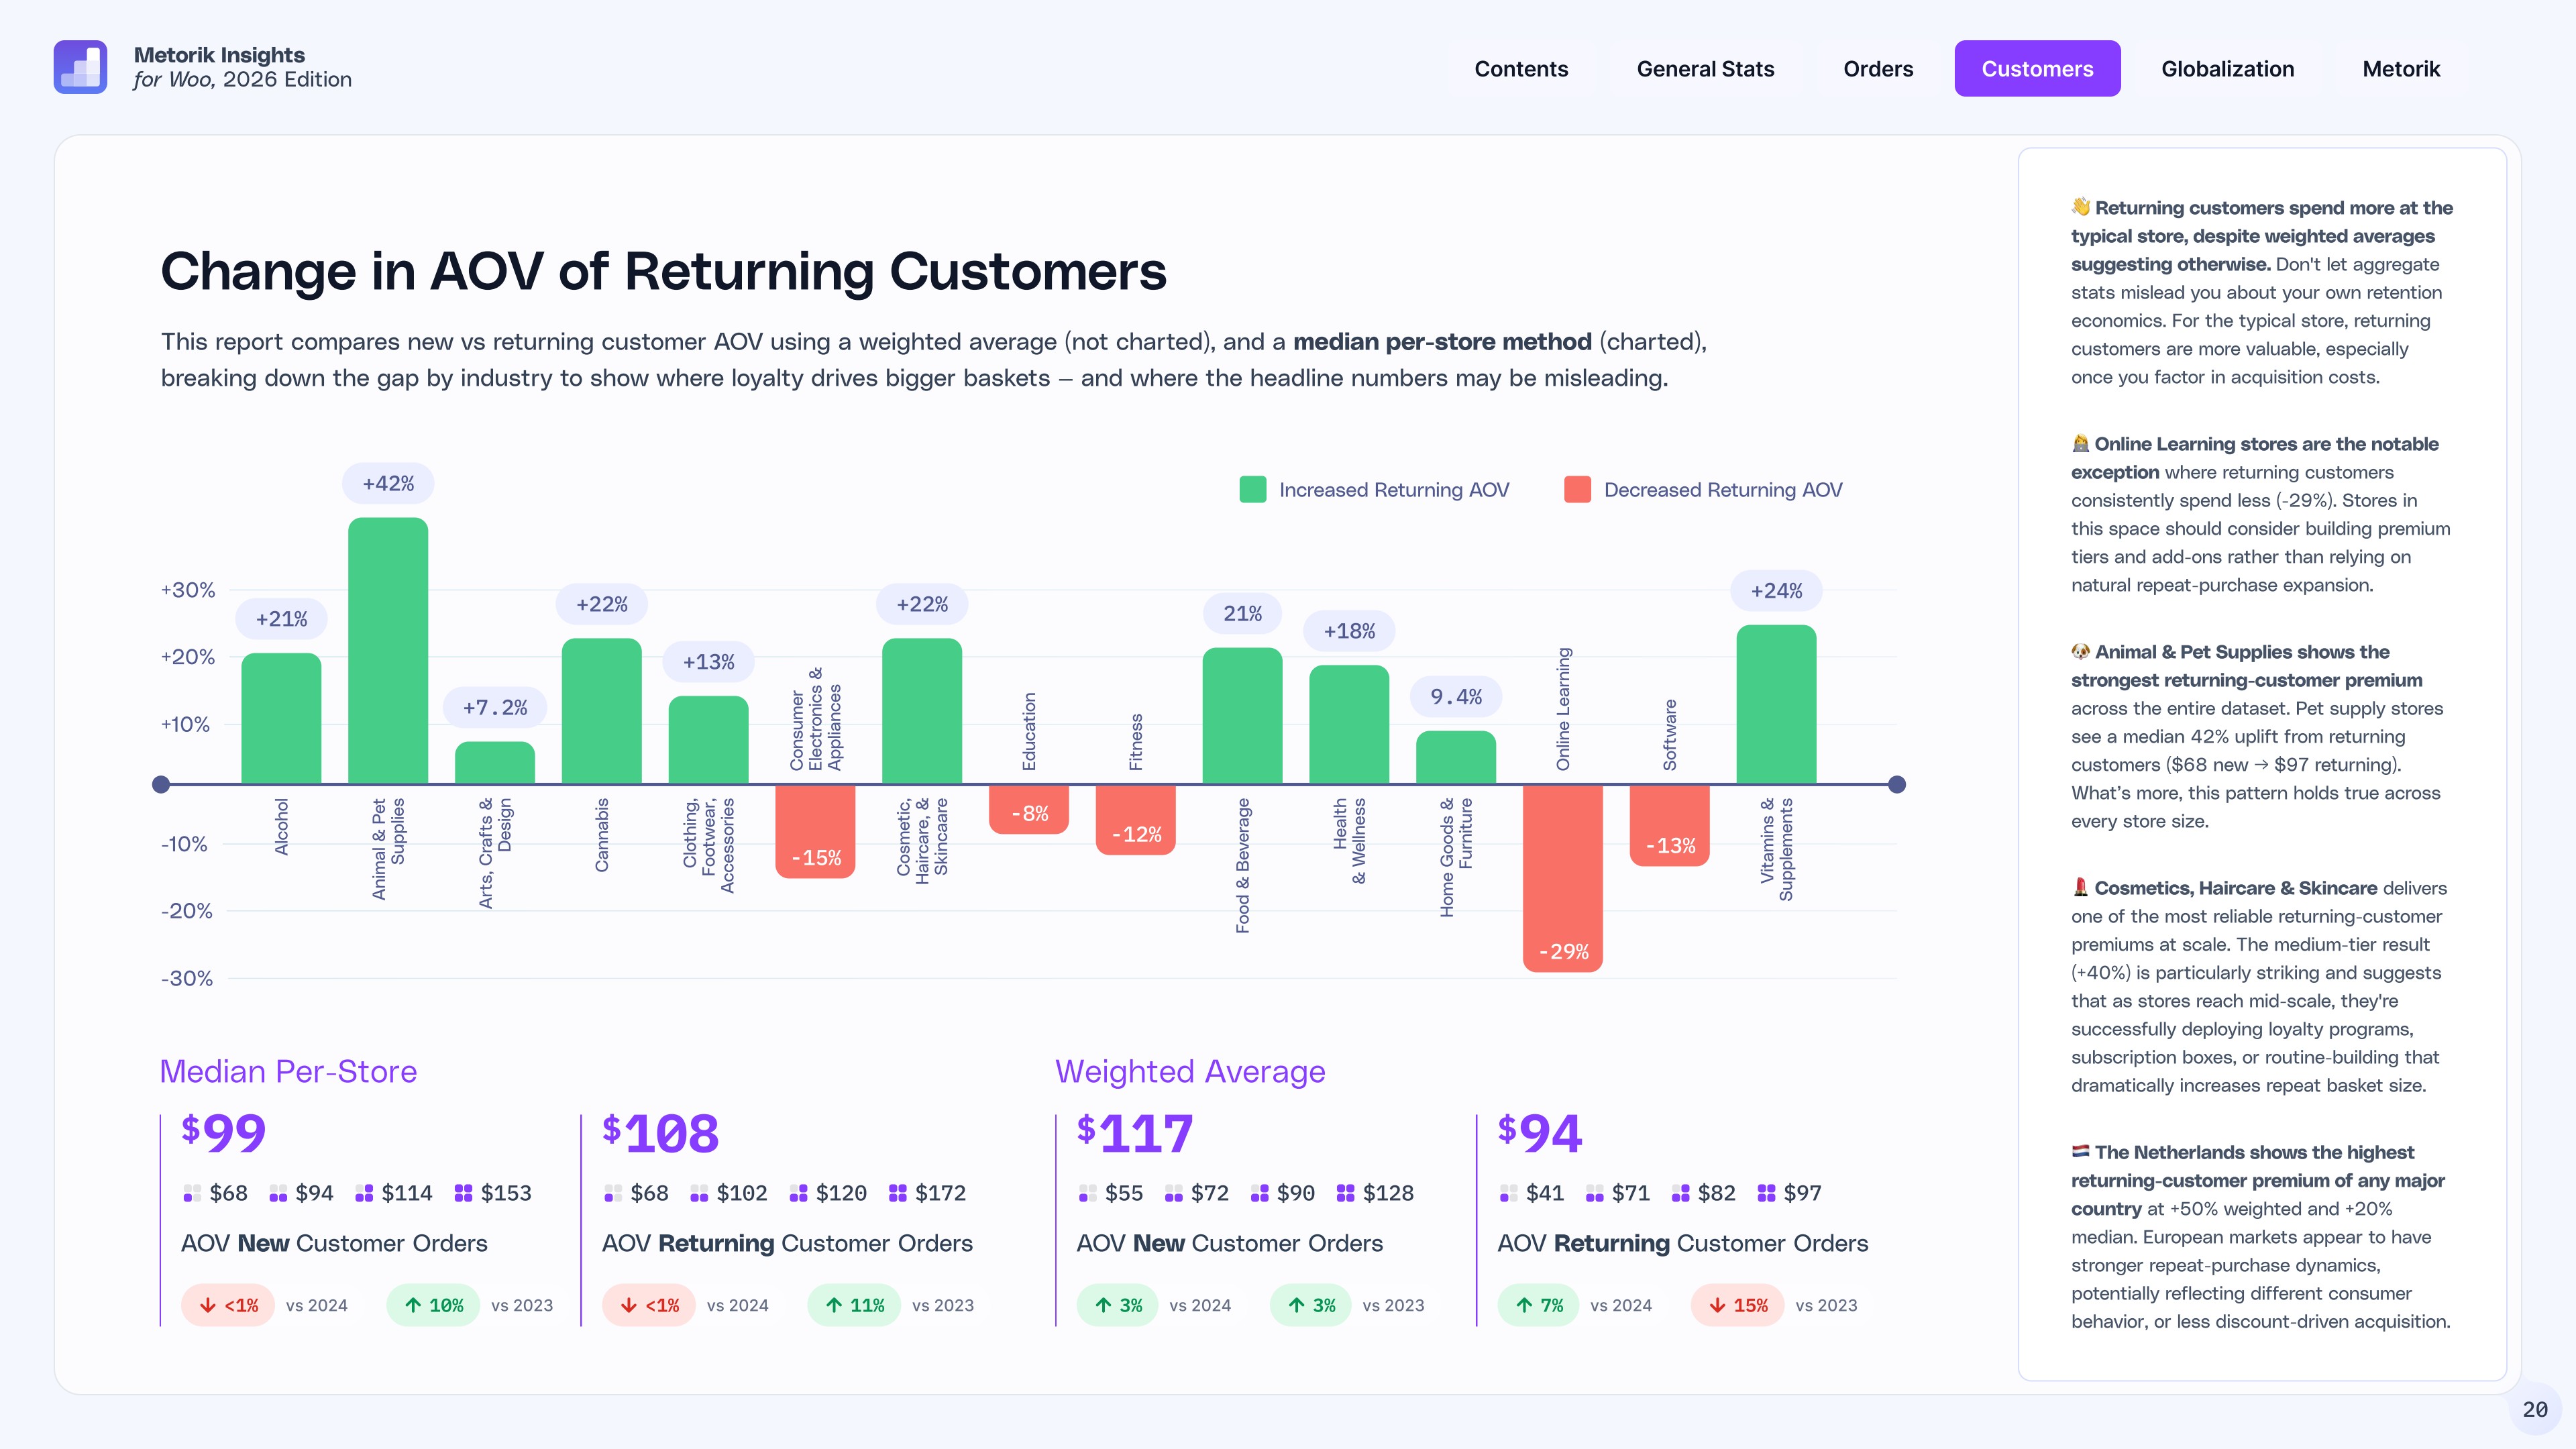
This is one of the most important findings in the report, and it requires a bit of nuance.
If you look at weighted averages across all stores, returning customers don't appear to spend much more. But when you calculate AOV at the individual store level and take the median, giving every store equal weight, returning customers spend significantly more at the typical WooCommerce store. The headline numbers are being dragged down by a few high-volume stores with different dynamics.
The industry breakdown is where it gets really interesting:
Animal & Pet Supplies leads the pack with a 42% returning-customer AOV premium, and it holds true across every store size.
Cosmetics, Haircare & Skincare delivers a 33% uplift, with medium-tier stores hitting an impressive 40%, suggesting successful loyalty programs and subscription boxes at scale.
Online Learning is the notable exception at -29%. Returning customers consistently spend less, suggesting these stores should consider premium tiers and add-ons rather than relying on natural expansion.
The Netherlands shows the highest returning-customer premium of any major country at +50% weighted, hinting that European markets may have stronger repeat-purchase dynamics overall.
What to do with this: Don't let aggregate stats mislead you about your own retention economics. Dig into your returning customer AOV at the store level using cohort reports and customer segmentation to understand what's really happening in your business.
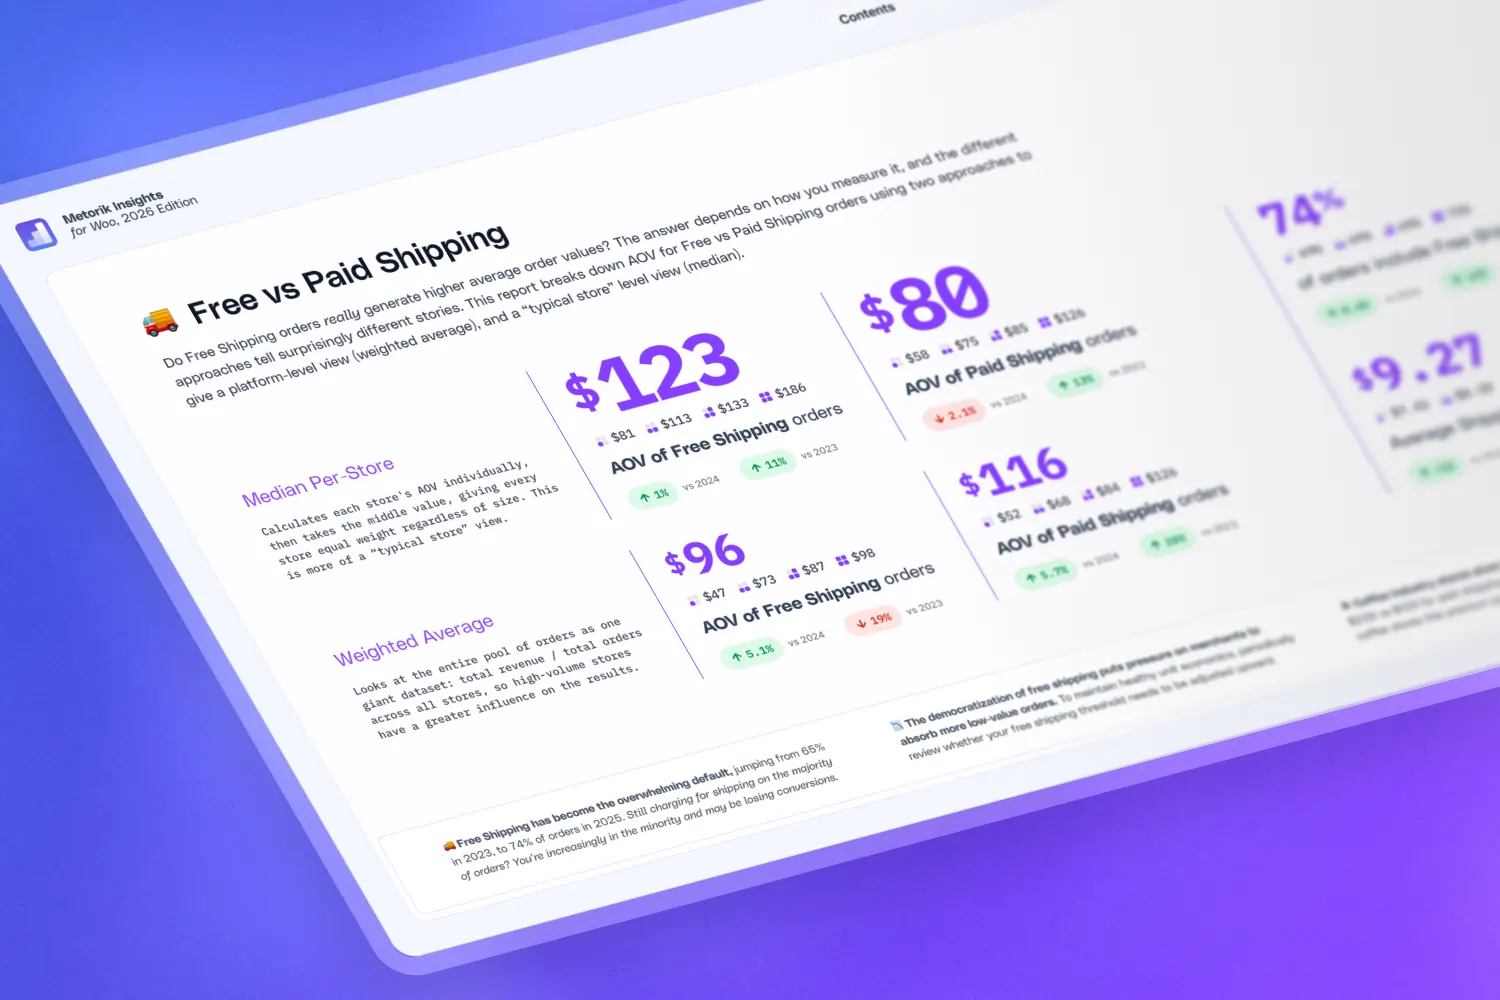
4. 74% of WooCommerce orders now ship Free
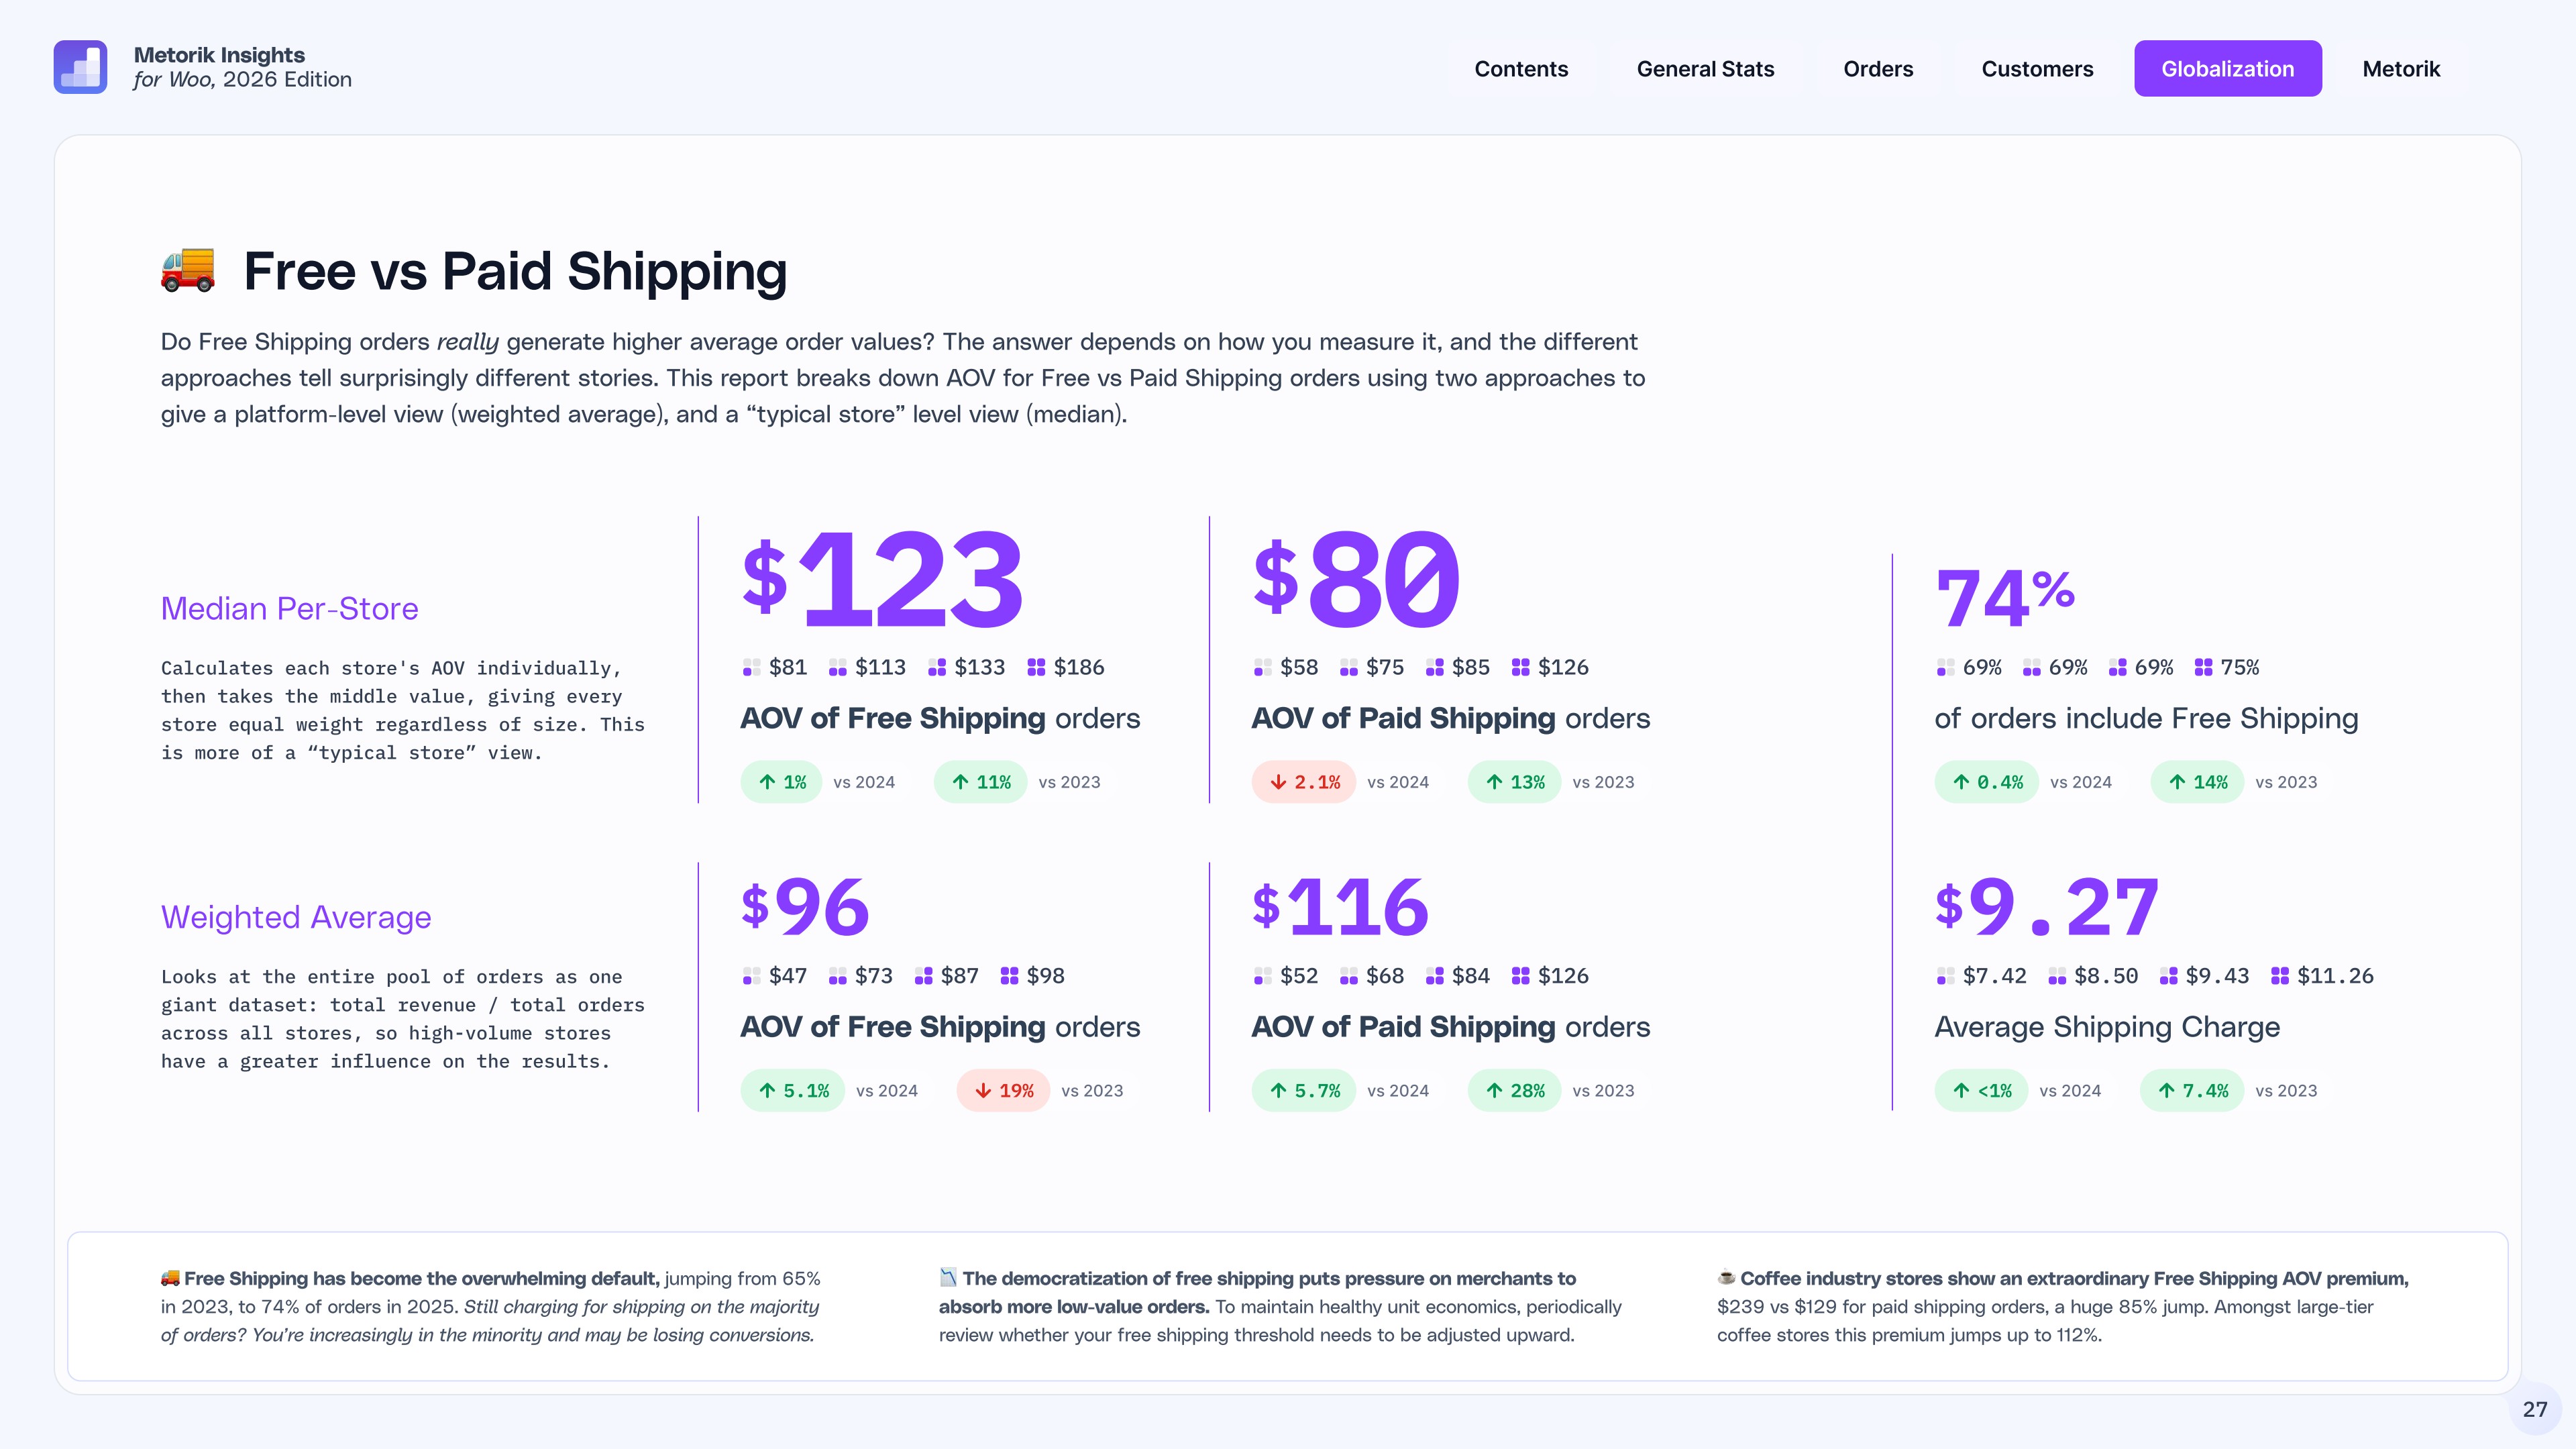
What percentage of WooCommerce orders include free shipping? It's now the overwhelming default. In 2023, 65% of orders included free shipping. By 2025, that number climbed to 74%. If you're still charging for shipping on the majority of orders, you're increasingly in the minority.
But here's what surprised us: at the typical store level, free shipping orders actually have a higher AOV ($123) than paid shipping orders ($80). This flips the common assumption that free shipping cannibalizes order value. What it really shows is that well-set free shipping thresholds are driving customers to add more to their cart.
Coffee stores take this to an extreme. Free shipping orders average $239 vs $129 for paid, an 85% premium. Among large coffee stores, that premium jumps to 112%.
What to do with this: Free shipping isn't just a cost center. It's a conversion and upsell lever. Review whether your free shipping threshold is set too low (leaving AOV on the table) or too high (losing conversions). The sweet spot is where it nudges customers to add just one more item. And for the carts that do get abandoned, automated cart recovery emails can help you win them back.
5. The farther away your customer, the more they spend
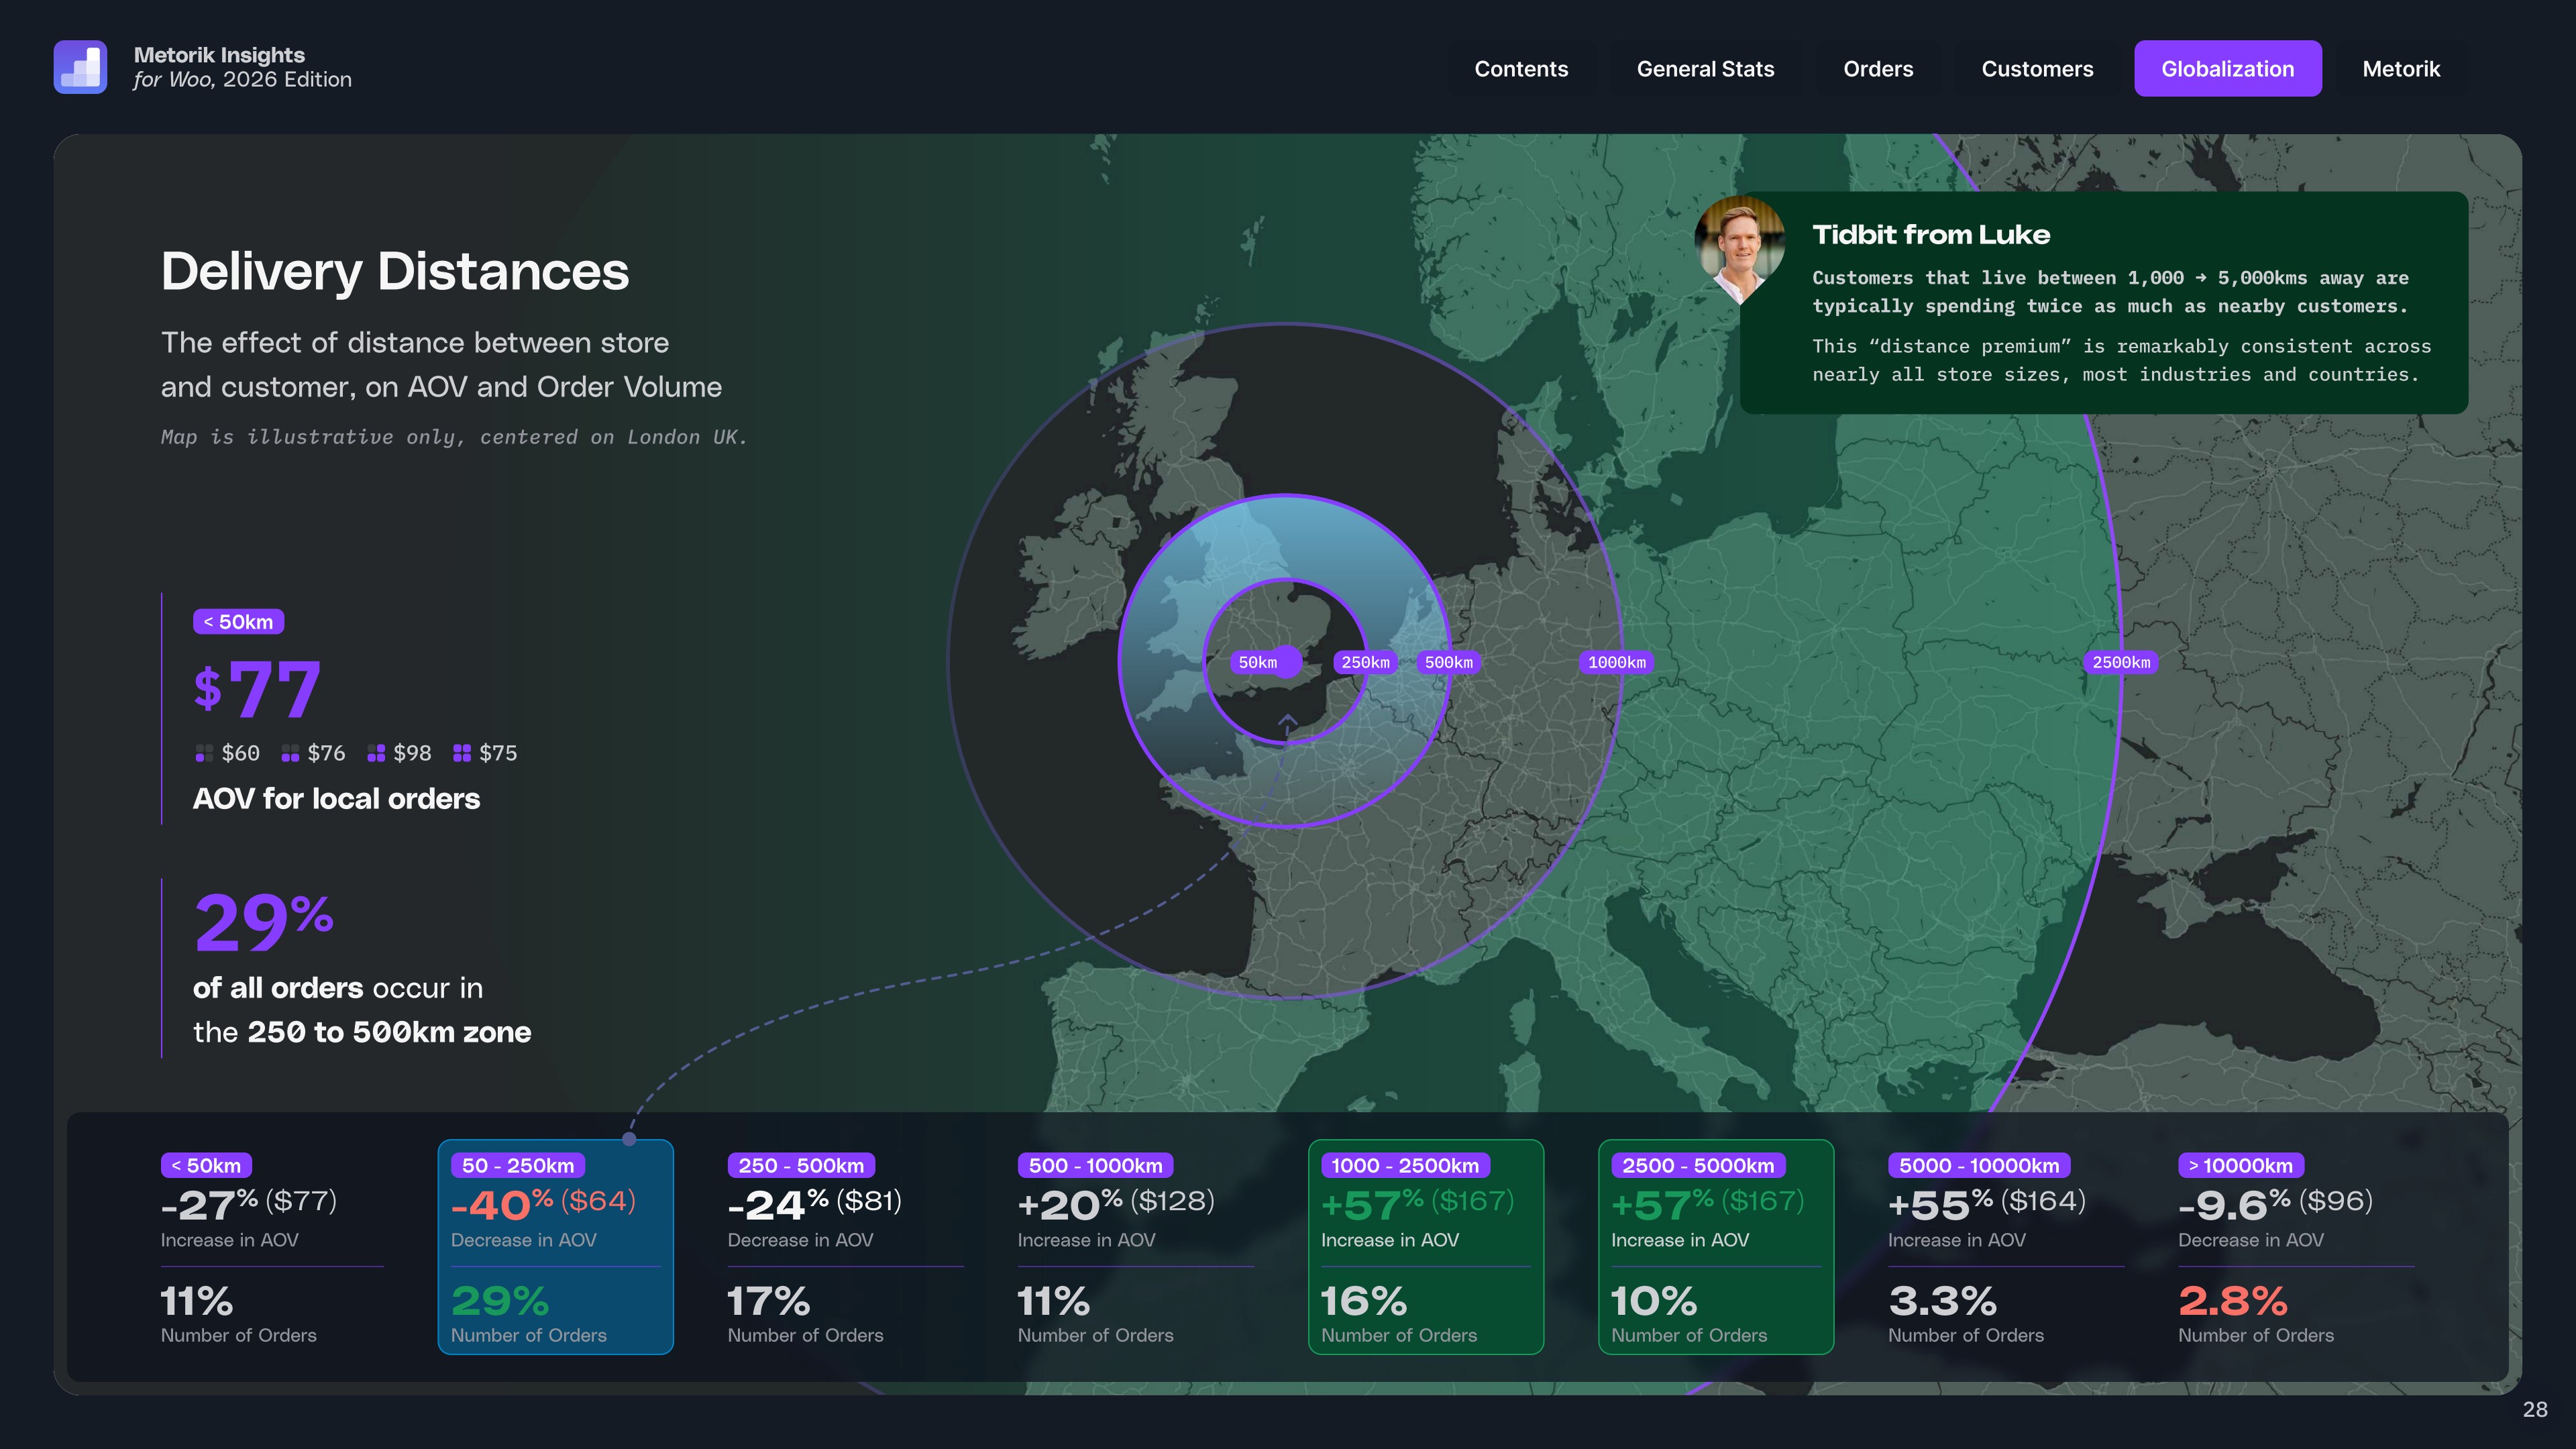
This was one of our favourite findings from this year's report.
By mapping the distance between a store's location and its customers' shipping addresses, we uncovered a remarkably consistent "distance premium." Customers who live 1,000 to 5,000km away typically spend roughly twice as much as local customers. Local orders (under 50km) average just $77, while orders in the 1,000-2,500km zone average $167.
The pattern is strikingly consistent across nearly all store sizes, most industries, and most countries. Why? Likely a combination of factors: distant customers order less frequently but in larger quantities to justify shipping costs, and selection effects mean only higher-intent buyers complete cross-border purchases.
Interestingly, the premium reverses for ultra-long-distance orders (10,000km+), where AOV drops back to $96. Perhaps at that distance, customers become more cautious with unfamiliar international merchants.
What to do with this: If you're only targeting local customers, you may be overlooking your highest-value buyers. Consider your cross-border shipping strategy and whether you're making it easy for distant customers to buy confidently.
6. Refund rates have nearly halved since 2023
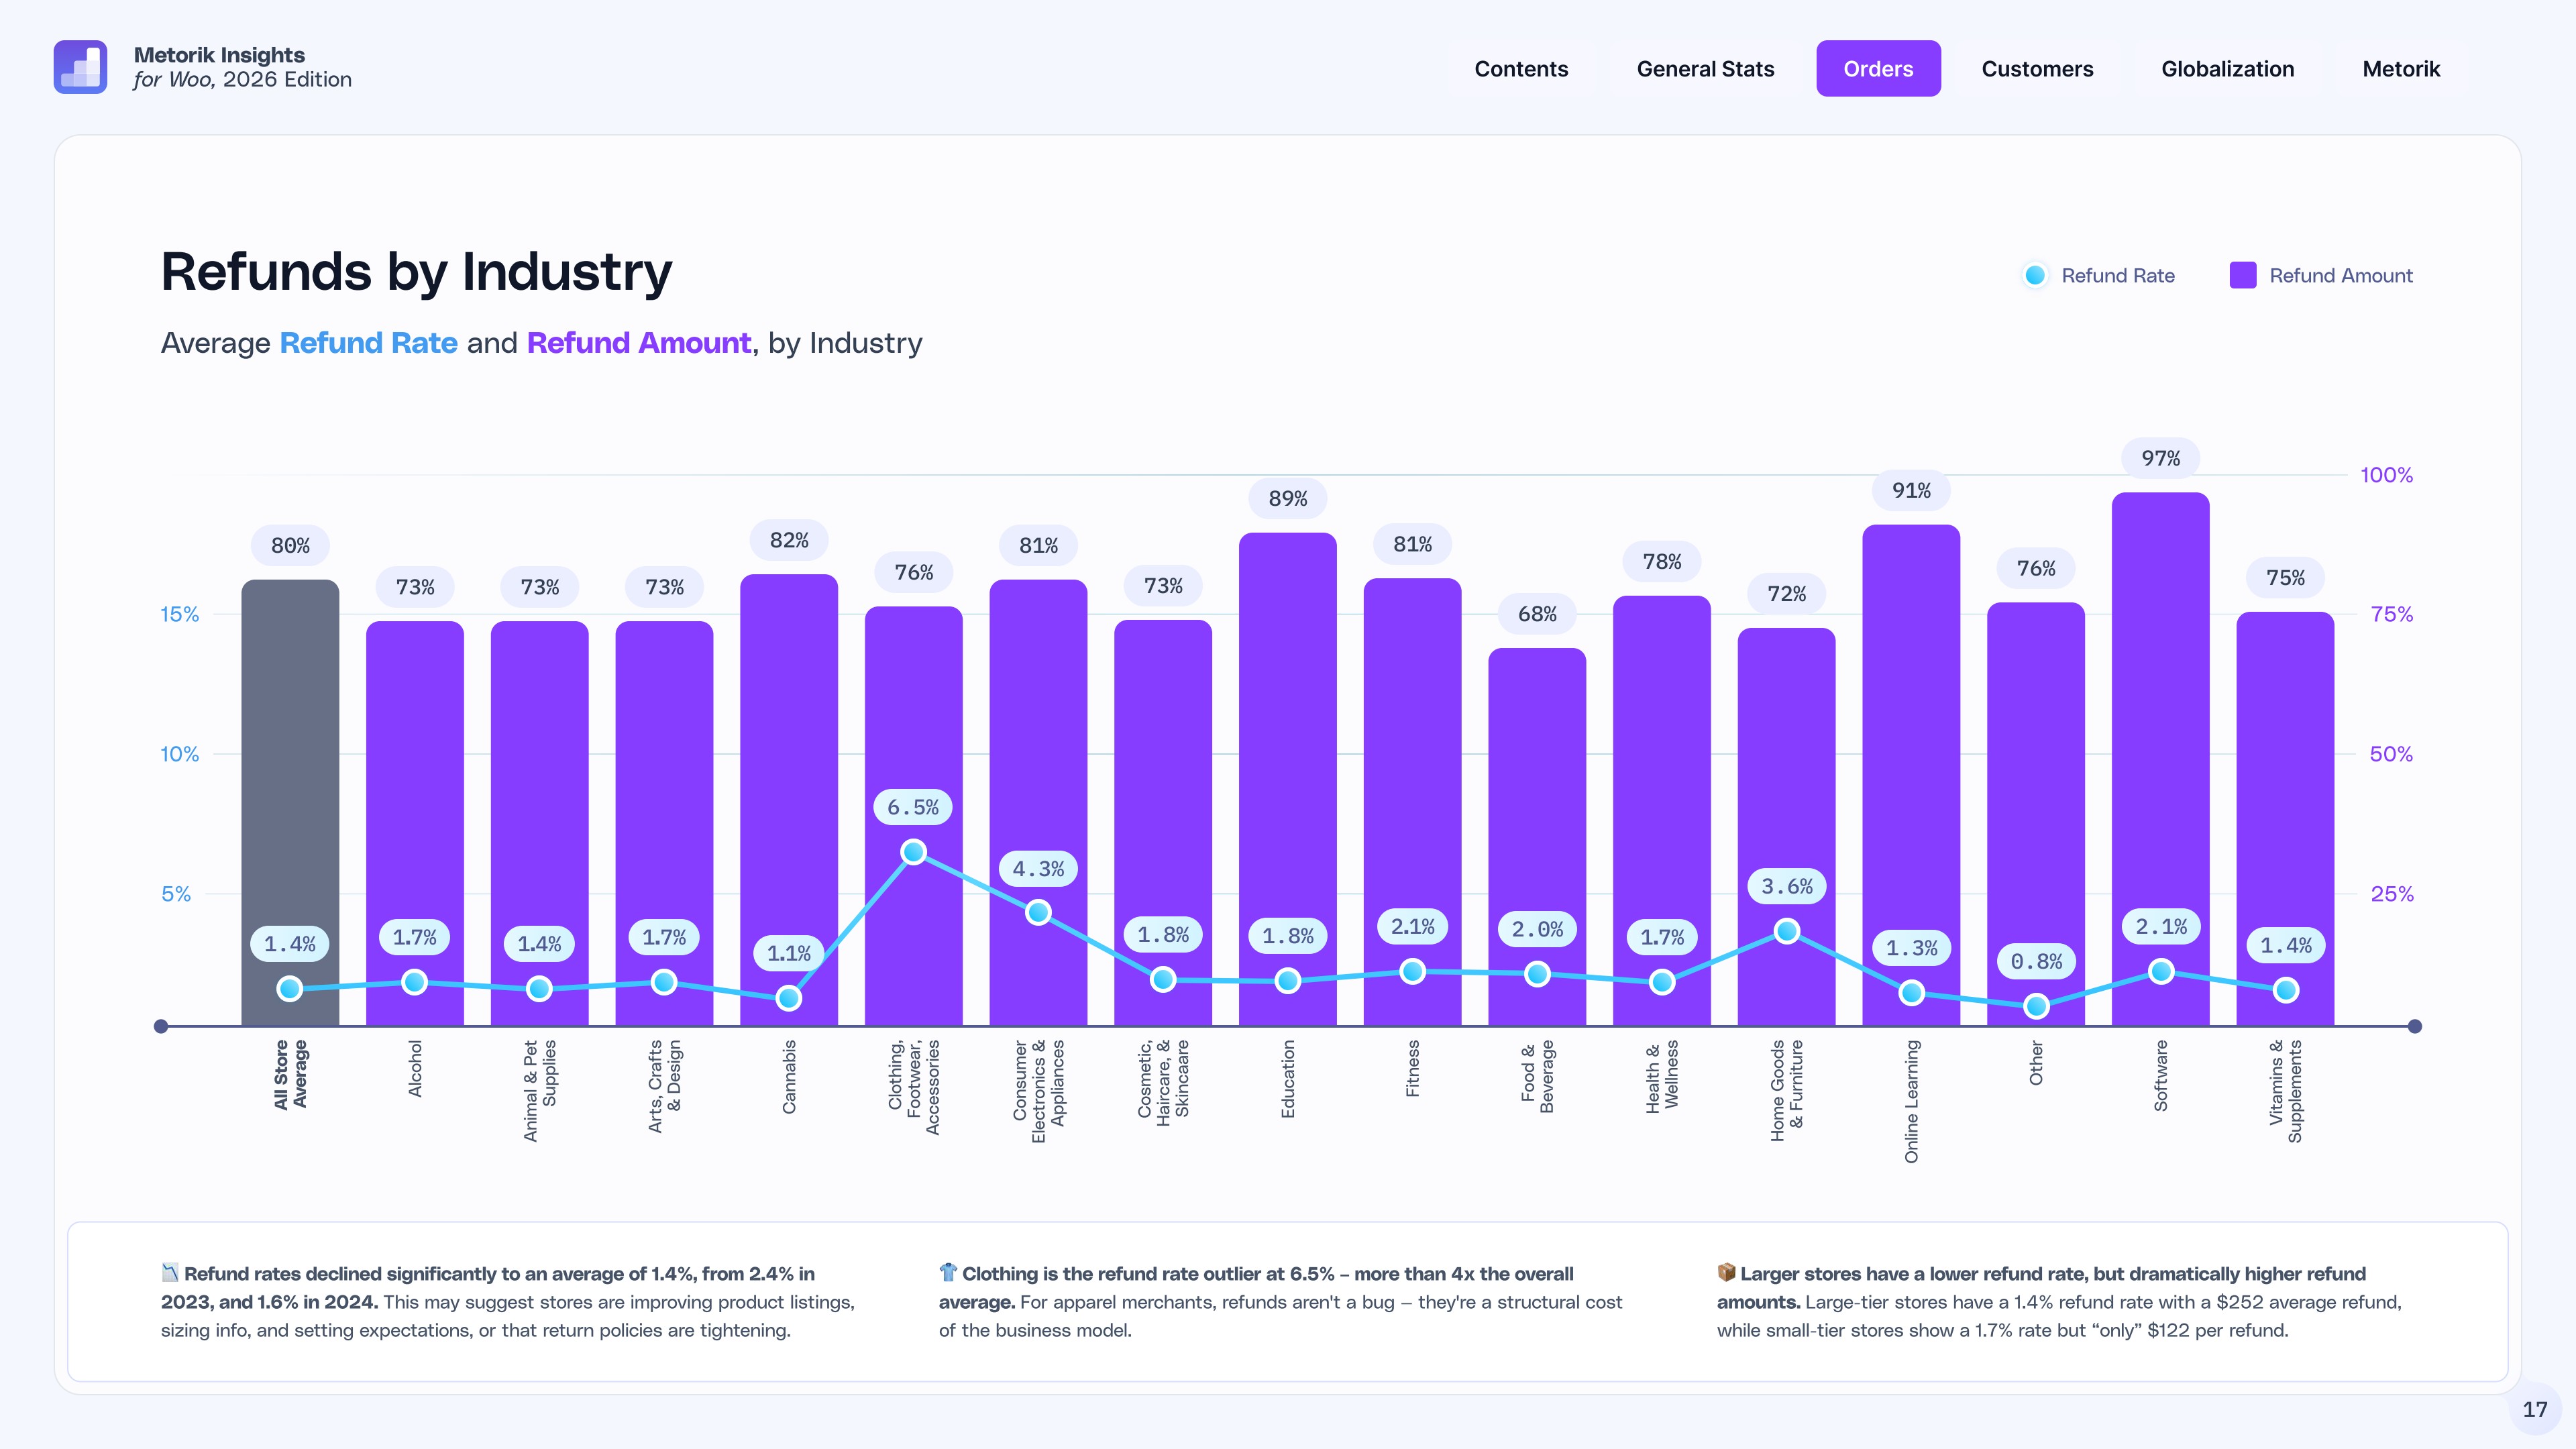
What is the average WooCommerce refund rate? It dropped significantly in 2025, hitting an average of just 1.4%, down from 2.4% in 2023 and 1.6% in 2024. That's a meaningful improvement across the ecosystem, suggesting stores are getting better at setting expectations through product listings, sizing information, and clearer policies.
The one major outlier? Clothing, Footwear & Accessories at 6.5%, more than 4x the overall average. For apparel merchants, refunds aren't a bug; they're a structural cost of the business model. If you sell clothes online, a 6-7% refund rate is your benchmark, not 1.4%.
An interesting scale dynamic emerges too: larger stores have a lower refund rate (1.4%) but dramatically higher refund amounts ($252 per refund vs $122 for small stores). The dollar impact of each refund grows as your business scales.
What to do with this: Use these benchmarks to gauge where you stand. If you're well above the average for your industry, invest in better product descriptions, photos, and sizing guides before tightening return policies. Tracking the true cost of refunds alongside your product margins is essential, and tools like Metorik's cost and profit reports make that straightforward.
7. The WooCommerce plugin stack isn't shrinking
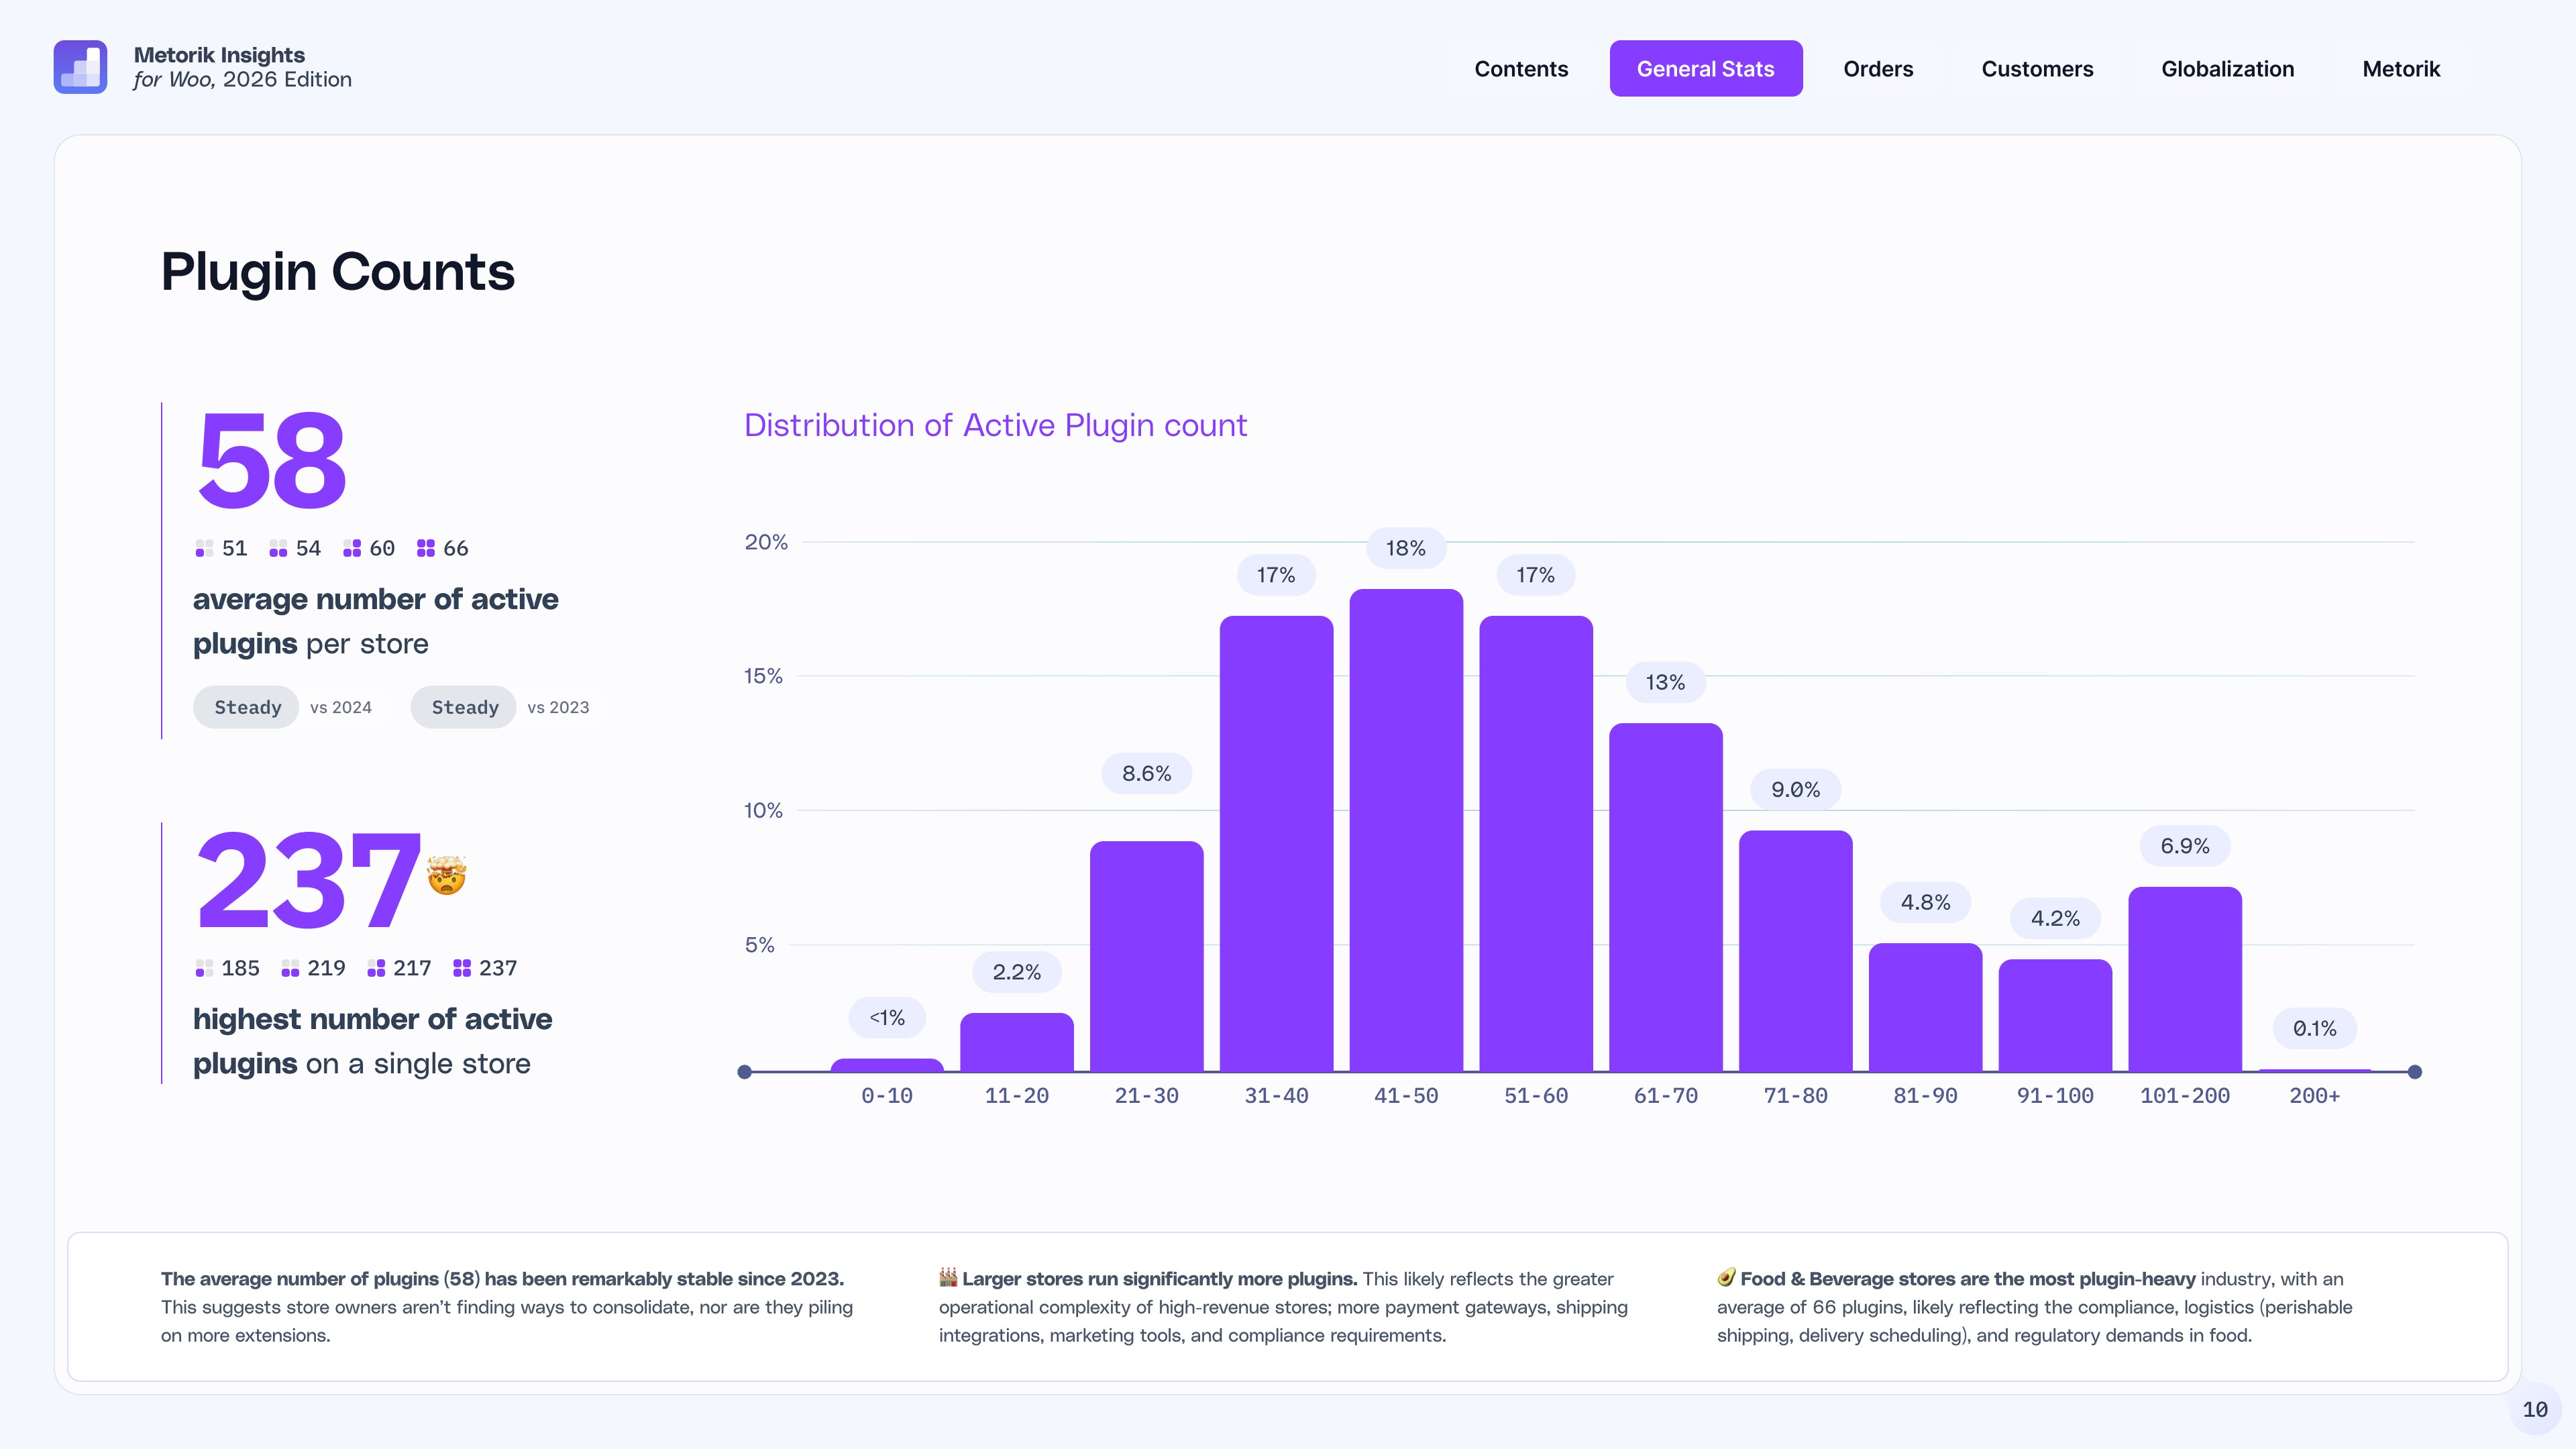
How many plugins does the average WooCommerce store use? The average store runs 58 active plugins, and that number has been remarkably stable since 2023. Store owners aren't finding ways to consolidate, nor are they piling on more. The plugin stack has plateaued.
Larger stores run significantly more, averaging 66 plugins, reflecting greater operational complexity: more payment gateways, shipping integrations, marketing tools, and compliance requirements. Food & Beverage stores are the most plugin-heavy industry at 66 average, likely driven by perishable shipping, delivery scheduling, and regulatory demands.
One stat that jumped out: Storefront, WooCommerce's own default theme, has fallen to just 0.8% market share. It now sits at the very bottom of the top 10 themes, edged out by page builders like Elementor (9.3%), Flatsome (7.4%), and Woodmart (4.5%). The ecosystem has clearly moved on.
On the version front, 42% of stores are running the latest WooCommerce version and 71% are on the latest WordPress version. But a meaningful minority still runs well behind modern standards, creating security and performance risks.
Download the full report
These seven findings are just a preview. The full 34-page report dives deep into areas we haven't touched here:
Subscription lifecycle patterns: when subscribers sign up, when they cancel, and why weekends are a "safe zone" for retention (see this for your own store with Metorik's subscription reporting)
Cart abandonment and recovery: how abandonment rates vary by industry, and how stores using Metorik Engage are winning back revenue
Discounting by industry: cannabis stores discount 45% of orders, while larger stores discount more often but with smaller amounts
Payment gateway AOV breakdown: bank transfer orders are nearly 3x the overall average, and Stripe shows the largest AOV gap between store sizes
Custom order statuses: 51% of stores have moved beyond default Woo statuses, with "Shipped/In Transit" and "Delivered" leading the way
Cross-currency and multi-country commerce: international shoppers spend 20% more per order, and multi-currency adoption is accelerating faster than geographic reach
Every metric includes year-over-year comparisons (2023 vs 2024 vs 2025) and breakdowns by store size, so you can benchmark yourself against stores that actually look like yours.
👉 Download the full Metorik Insights for WooCommerce 2026 report here. It's free!
And if the data in this report has you curious about what's happening inside your store, Metorik can show you all of these metrics, and hundreds more, for your own WooCommerce data.
📊 Looking for even more WooCommerce insights? Wombat Plugins also just released their WooCommerce Data Insights, 2026 Edition report which explores the expected life of a Woo store, how many stores move away from Woo, site speeds, and the adoption of the Blocks checkout. You can check it out here: https://www.studiowombat.com/blog/woocommerce-data-insights-2026-edition/
Frequently asked questions
What is the average order value for WooCommerce stores?
Based on 65 million orders placed in 2025, the average WooCommerce order value (AOV) is $105. However, this varies significantly by day of week ($116 on Tuesdays vs $86 on weekends), by device ($167 on desktop vs $71 on mobile), and by industry.
What percentage of WooCommerce orders are placed on mobile?
72% of WooCommerce orders were placed on mobile devices in 2025, up from approximately 62% in 2023. However, desktop shoppers still spend 2.3x more per order on average.
What is the average WooCommerce refund rate?
The average WooCommerce refund rate in 2025 is 1.4%, down from 2.4% in 2023. Clothing and apparel stores are the major exception at 6.5%, more than 4x the overall average.
How many plugins does the average WooCommerce store use?
The average WooCommerce store runs 58 active plugins, a number that has remained stable since 2023. Larger stores (over $1M revenue) average 66 plugins. The most popular WooCommerce plugin is Stripe Gateway (40% of stores), and the most popular WordPress plugin is Yoast SEO (49%).
What percentage of WooCommerce orders include free shipping?
74% of WooCommerce orders included free shipping in 2025, up from 65% in 2023. Free shipping orders also tend to have a higher average order value ($123) than paid shipping orders ($80) at the typical store, suggesting that well-set free shipping thresholds drive larger baskets.
Where can I download the full report?
The full 34-page Metorik Insights for WooCommerce 2026 report is available as a free download at metorik.com/woocommerce-insights.