Multistore Reporting and Dashboard
Run several WooCommerce stores, several Shopify stores, or a mix of both? See revenue, profit, products and stock velocity and inventory across all of them in one dashboard.
- Combine Shopify & Woo
- Products & Stock
- Blended ROAS & POAS


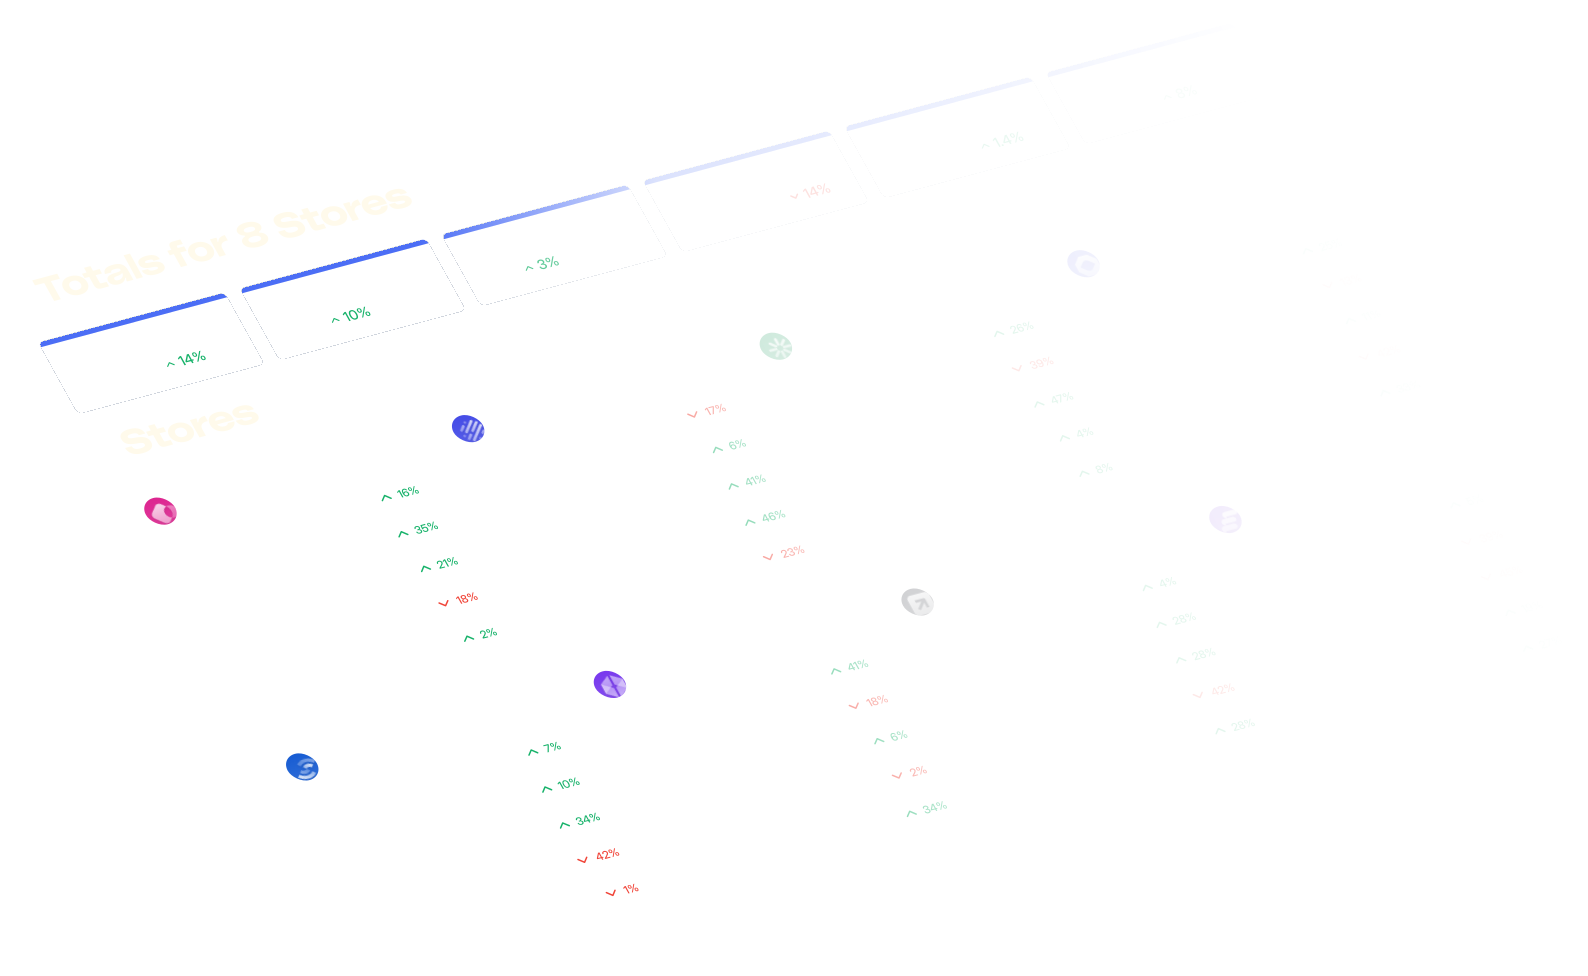


Get a birds-eye view across all your stores.
Collating data from each store in a spreadsheet becomes painful and error-prone around store number two.
Metorik's Multi-Store Dashboard gives you a top level answer across your whole business: revenue, orders, customers, costs and profit across every store – WooCommerce and Shopify alike – in the currency you choose. Every store shows growth against the comparison period, so the store that's slipping stands out while there's still time to act.
Powering multi-store brands and agencies around the world:


Matched by SKU, across every store
Sell the same products through more than one store? You'll know better than most – product reporting gets messy, fast .
Metorik matches products and variations across stores by SKU so each item shows up once, with total units sold and revenue across every store, and a store-by-store split beside it.
Search products by title or SKU. Show only products stocked in every store. Toggle gross or net. Export the lot to CSV, with barcodes if you need them, and hand it to whoever does the buying.
From brands running more than one store:


⭐⭐⭐⭐⭐
We were searching for a solution to keep track of our sales data across multiple global websites.
From set up to working with the Metorik team directly, everything has been seamless and easy for what we initially thought would be an extremely complex process.
— Zach Wright
UX Design, La Marzocco Home 🇺🇸


⭐⭐⭐⭐⭐
Our business has multiple online shop fronts so the main draw was being able to combine these streams into one dashboard. The stats and data available are great and really helping us refine the business.
— Kris Inkster
CEO, Start Training 🇦🇺


⭐⭐⭐⭐⭐
All our stores in one place! Love the custom dashboard.
— Max Bisseling
E-commerce Manager, Online Plastics Group 🇳🇱


⭐⭐⭐⭐⭐
Especially as an agency, it allows us to train our people really quickly, answer questions quickly, and actually provide accurate reporting.
We really love Metorik, we can do a whole lot of crazy stuff. It's an awesome product.
— Julien Melissas
CTO, Craftpeak 🇺🇸


⭐⭐⭐⭐⭐
My digital marketing agency specializes in WordPress and Shopify, and now we are able to provide our clients with the absolute best reporting tool, ever. My clients think I'm a genius, which makes me feel pretty special.
— Greta Rose Zagarino
Founder, Greta Rose Agency 🇺🇸
How multi-store brands and agencies are using it:
Login once, see every store
Regional storefronts, separate brands, Shopify Plus expansion stores, a WooCommerce store all side by side. Connect each one and the whole business shows up in a single view.
See who's winning, and who's slipping
The comparison table view puts every store on the same row set, with growth against the previous period, so under-performers are made obvious while there's still time to intervene.
Rebalance inventory before it runs out
Multistore Stock Velocity shows number of days of stock remaining for every product in every store, so you can move stock from the store that has it to the store that needs it.
Stock velocity across every store. Know your days of inventory before you stock out.
Select a lookback period from a week to a year, and Stock Velocity shows your estimated days of remaining for every product and variation, with a projected stockout date, both combined and store by store.
So you know what's moving, which store is about to run out, and where stock is sitting idle. Export the list and hand it to whoever does the buying.
Covers stock-managed products and variations that sold in the selected period, from the top 1,000 sellers in each store. Read the launch post or see single-store product reports .
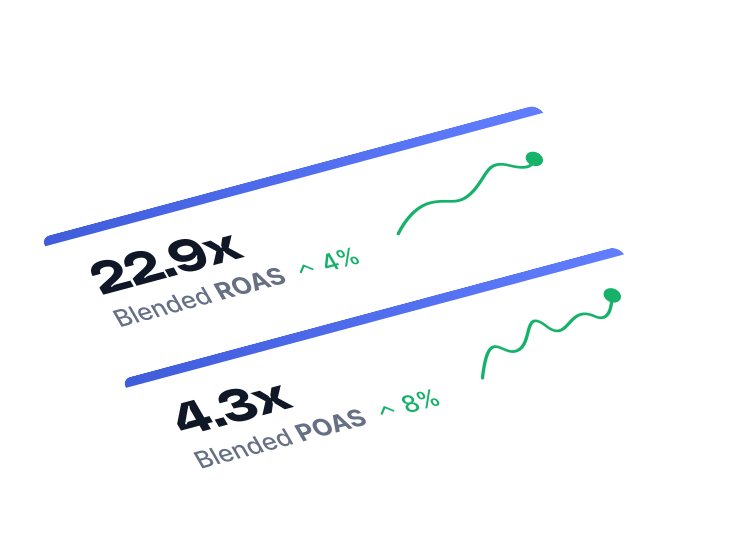
Blended ROAS and POAS
Metorik sums revenue, profit and ad spend across your visible stores, converts them to your dashboard currency, and shows how you're tracking.
Ad costs sync automatically from AppLovin, ChatGPT Ads, Google, Meta, Microsoft, Pinterest, TikTok, Snapchat, Reddit or Google Sheets, and cost of goods from your store or a CSV. See how costs and profit tracking works.
Up and running in minutes:
1. Add your stores
Connect each WooCommerce or Shopify store to Metorik in a few clicks. Historical orders, customers and products sync automatically. No developer needed.
2. Open Multi-Store
Head to the Multistore view and every connected store is already there: combined totals, per-store cards, products, variations and Stock Velocity.
3. Invite your team
Team members are managed per store, so give a manager their store and yourself the lot. No per-user fees, and billing is based off your combined order volume across all stores.
Multi-Store Dashboard & Reporting FAQs
Can't find what you're looking for below? Read our Help Docs
Can I combine Shopify and WooCommerce stores in one dashboard?
Yes. Connect as many WooCommerce and Shopify stores as you like to one Metorik account. The Multistore Dashboard combines them all into one set of totals, with each store listed underneath so you can still compare them side by side.
How many stores can I connect to Metorik?
There's no cap on the dashboard itself, we have many global brands with 50+ stores. Add every Shopify or Woo store you run and Metorik combines them for you. If you ever want to leave one out of the totals, simply hide it using the multistore settings.
How does Metorik's pricing work for multiple stores?
Billing is based off your combined average order volume across all your stores, no separate subscription per store. Every feature is included on every plan, and there are no per-user fees, so your whole team can use it. Read more about billing for multiple stores.
Does it work with WooMultistore, WordPress Multisite, or separate WooCommerce installs?
Absolutely. Whether your Woo stores run on the WooMultistore plugin, a WordPress Multisite network, or completely separate installations, each site connects to Metorik as its own store, and the numbers roll up into the Multistore Dashboard.
Does it work with Shopify Plus expansion stores or multiple Shopify stores under one account?
Yes. Each Shopify store, including Shopify Plus expansion stores for different regions or brands, connects to Metorik as its own store. You get combined totals across all of them plus per-store cards, and you can jump straight into any individual store from the dashboard.
What if my stores use different currencies?
You can select to view your stats in any of your store's currencies. Metorik will automatically convert the store totals into it using current exchange rates, so revenue, profit, and blended ROAS are comparable across stores. You can also view totals for each currency separately.
Do I need cost of goods and ad spend data for the dashboard to work?
No. Combined revenue, orders, items, customers, products, and stock velocity work out of the box. The profit, margin, and blended ROAS and POAS cards appear once at least one store has cost of goods and advertising costs configured. See how costs and profit tracking works.

Still have questions?
Can't find the answer you're looking for? Chat to our friendly team.

Every store, one dashboard. Try it free for 30 days.
Metorik is just a few clicks to connect — no developers required.
💳 Metorik is Free for 30 days, no credit card required.