Metorik was built from the ground up to deliver your eCommerce metrics both quickly and beautifully. However, with so many different reports, charts, figures and segmenting options, it can often be hard to know where to begin when trying to analyse your data.
But don’t fret, we have gone through every single report in Metorik with a fine-tooth comb to bring you a quick-start guide of the most important eCommerce metrics we think you should be looking at:
Net revenue & net sales
Revenue is the bread and butter of any business. No Revenue = No Profit = No Business.
While net revenue and net sales sound like the same thing there are some subtle differences which make both of them valuable in their own right.
Net Revenue
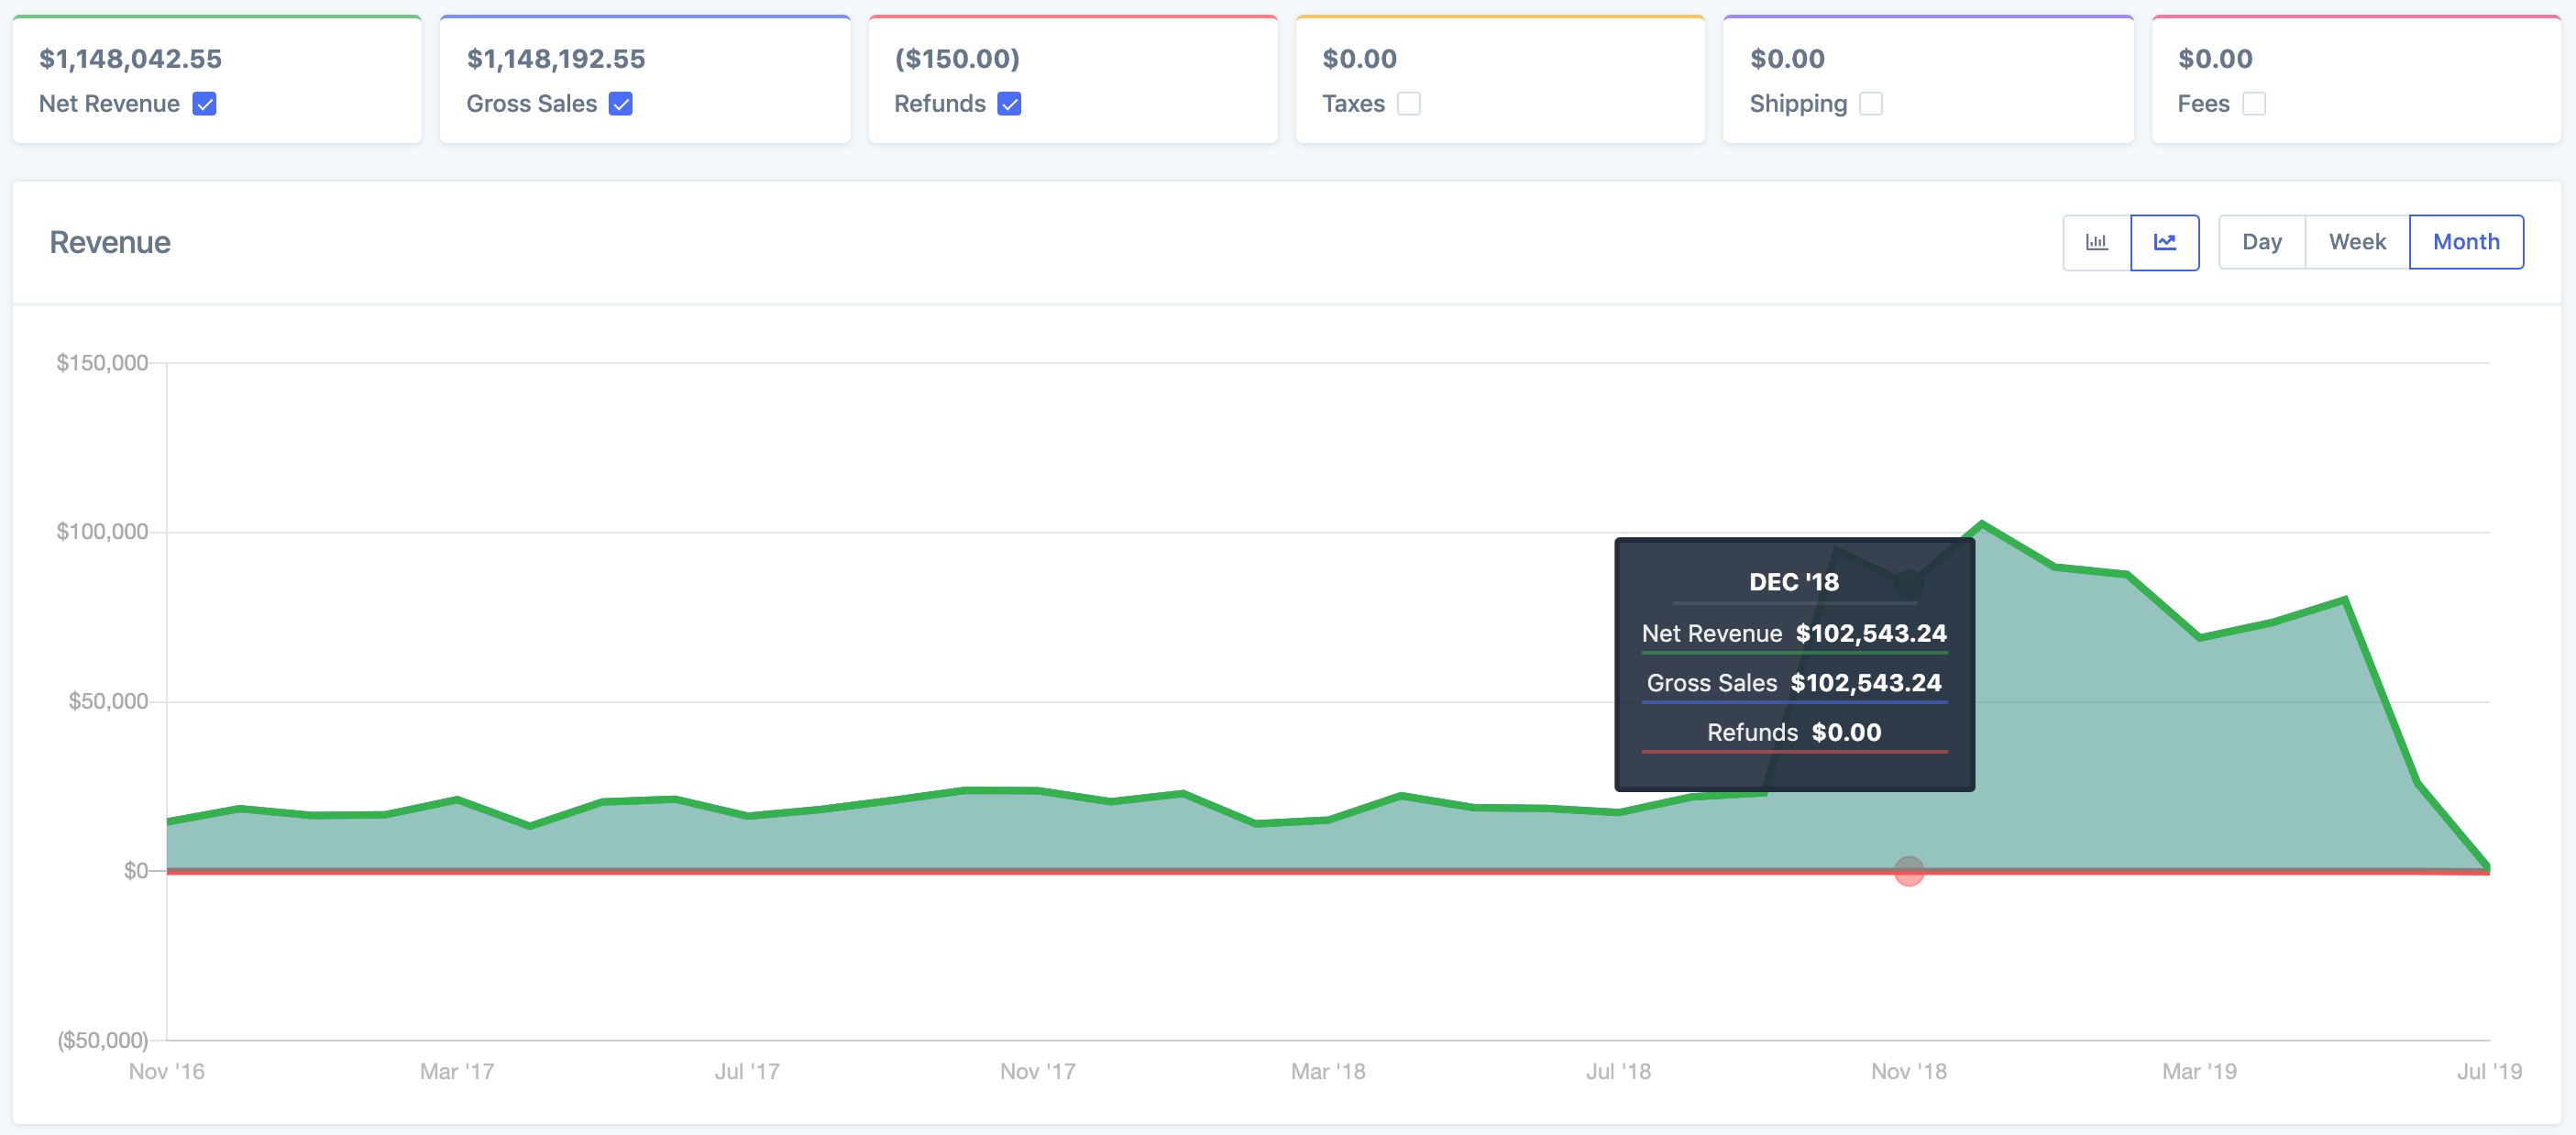
Found in the revenue report and your dashboard, net revenue is exactly what it sounds like, the revenue in a given period. It gives you an idea of how much money you actually received from your orders. It is calculated using the following formula:


Note that you can tweak whether you want taxes, shipping and fees factored into the equation in your store settings.
Net Sales
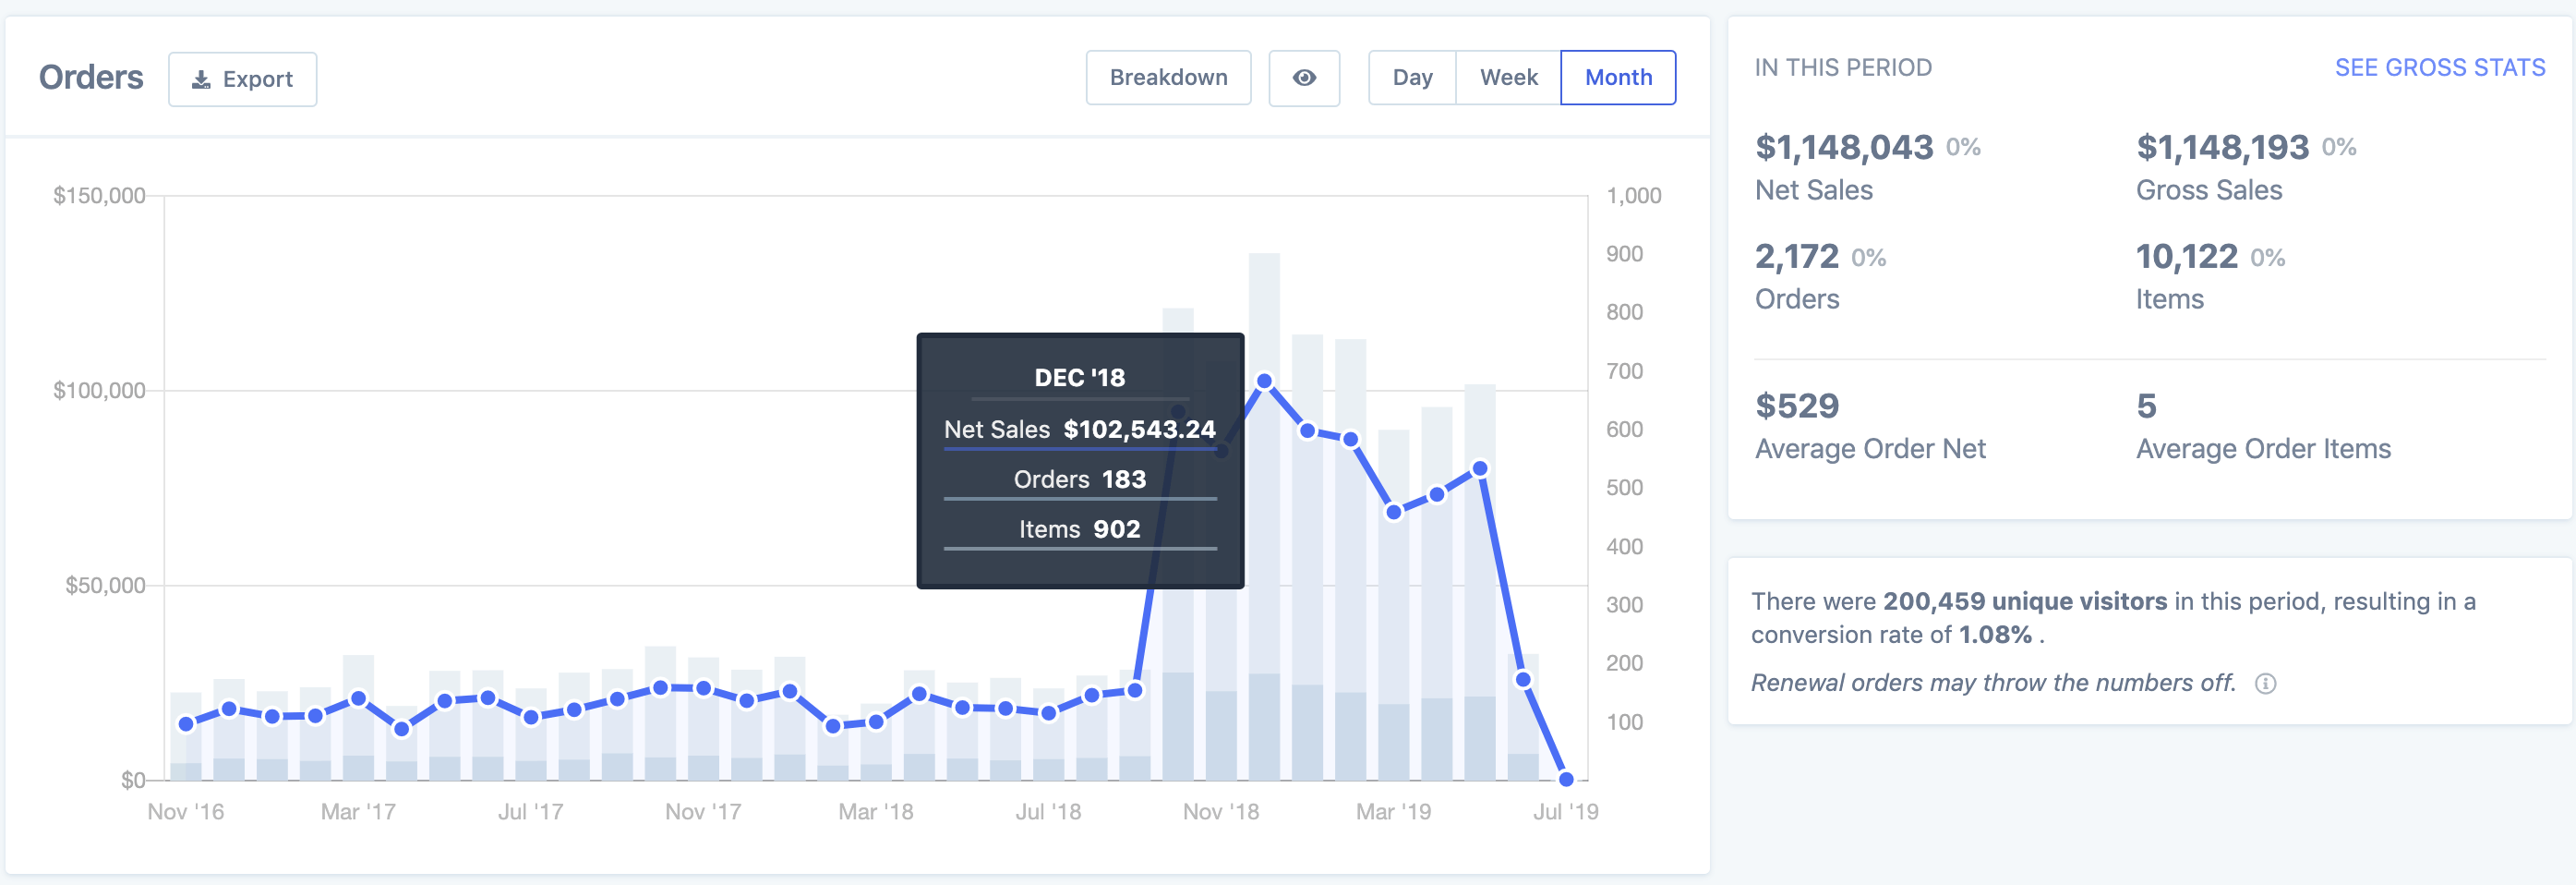
Net sales is very similar to net revenue with one crucial difference, the date which refunds are deducted. It only deducts refunds for orders made in a given period and when the refund happened does not matter. The formula is almost exactly the same as the one above:


The difference between net revenue and net sales is best demonstrated with a simple example. You run an eCommerce store, and in January 2019 there was an order for $100, which was later refunded in February 2019. For simplicity, there are no taxes, shipping or fees and no other orders.
Using the formulas above:
January net revenue = 100 (gross sales) - 0 (refunds in current period) = $100
January net sales = 100 (gross sales) - 100 (refunds from any period relating to this order, ie: the refund in February) = $0
and:
February net revenue = 0 (gross sales) - 100 (refunds in current period, ie: the refund in February) = -$100
February net sales = 0 (gross sales) - 0 (refunds from any period relating to this order) = $0
Customer lifetime value (LTV)
While all customers are important, not all customers are created equal. Customers that have spent more money than others tend to be more valuable to you as a store owner.
The best metric to measure how valuable a customer is their LTV. LTV is very simple and is calculated by taking the total gross orders made by a customer less total refunds. The formula for this is:

So if a customer has spent a total of $500 but had $150 refunded, then:
customer LTV = 500 - 150 = $350
This can be found under total spent on an individual customer page:
-(1).png)
If we then sum the LTV of every customer and then divide by the number of customers, we are then given the average LTV per customer. This is found in the customer report:
.png)
Now that we know that our average LTV is $637.12, we could send use Engage an email to all customers with an LTV greater than this saying thank you and offering them a coupon code.
Similarly, we could use this number to inform our marketing efforts. Knowing that our average LTV is $637.12, and our average cost is ~50%, we could estimate an average LTV profit of around $320 per customer. We could then attempt to spend close to that number (the lower the better) on paid advertising to attract each new customer.
Retention Rate
It is far more costly to get new customers than it is to retain current ones. After all, your current customers are the ones who have already shown trust in your store and punched in their credit card number.
Your customer retention rate can give you insight into how well you are retaining your customers. The higher the retention rate, the more customers are coming back to your store and making another purchase. A low retention rate means that you might need to go back to the drawing board and rethink your customer purchasing journey.\f
.png)
Your customer retention rate looks at a time period and measures out of all the customers that made an order, how many came back and made another order. It is calculated using the following equation:

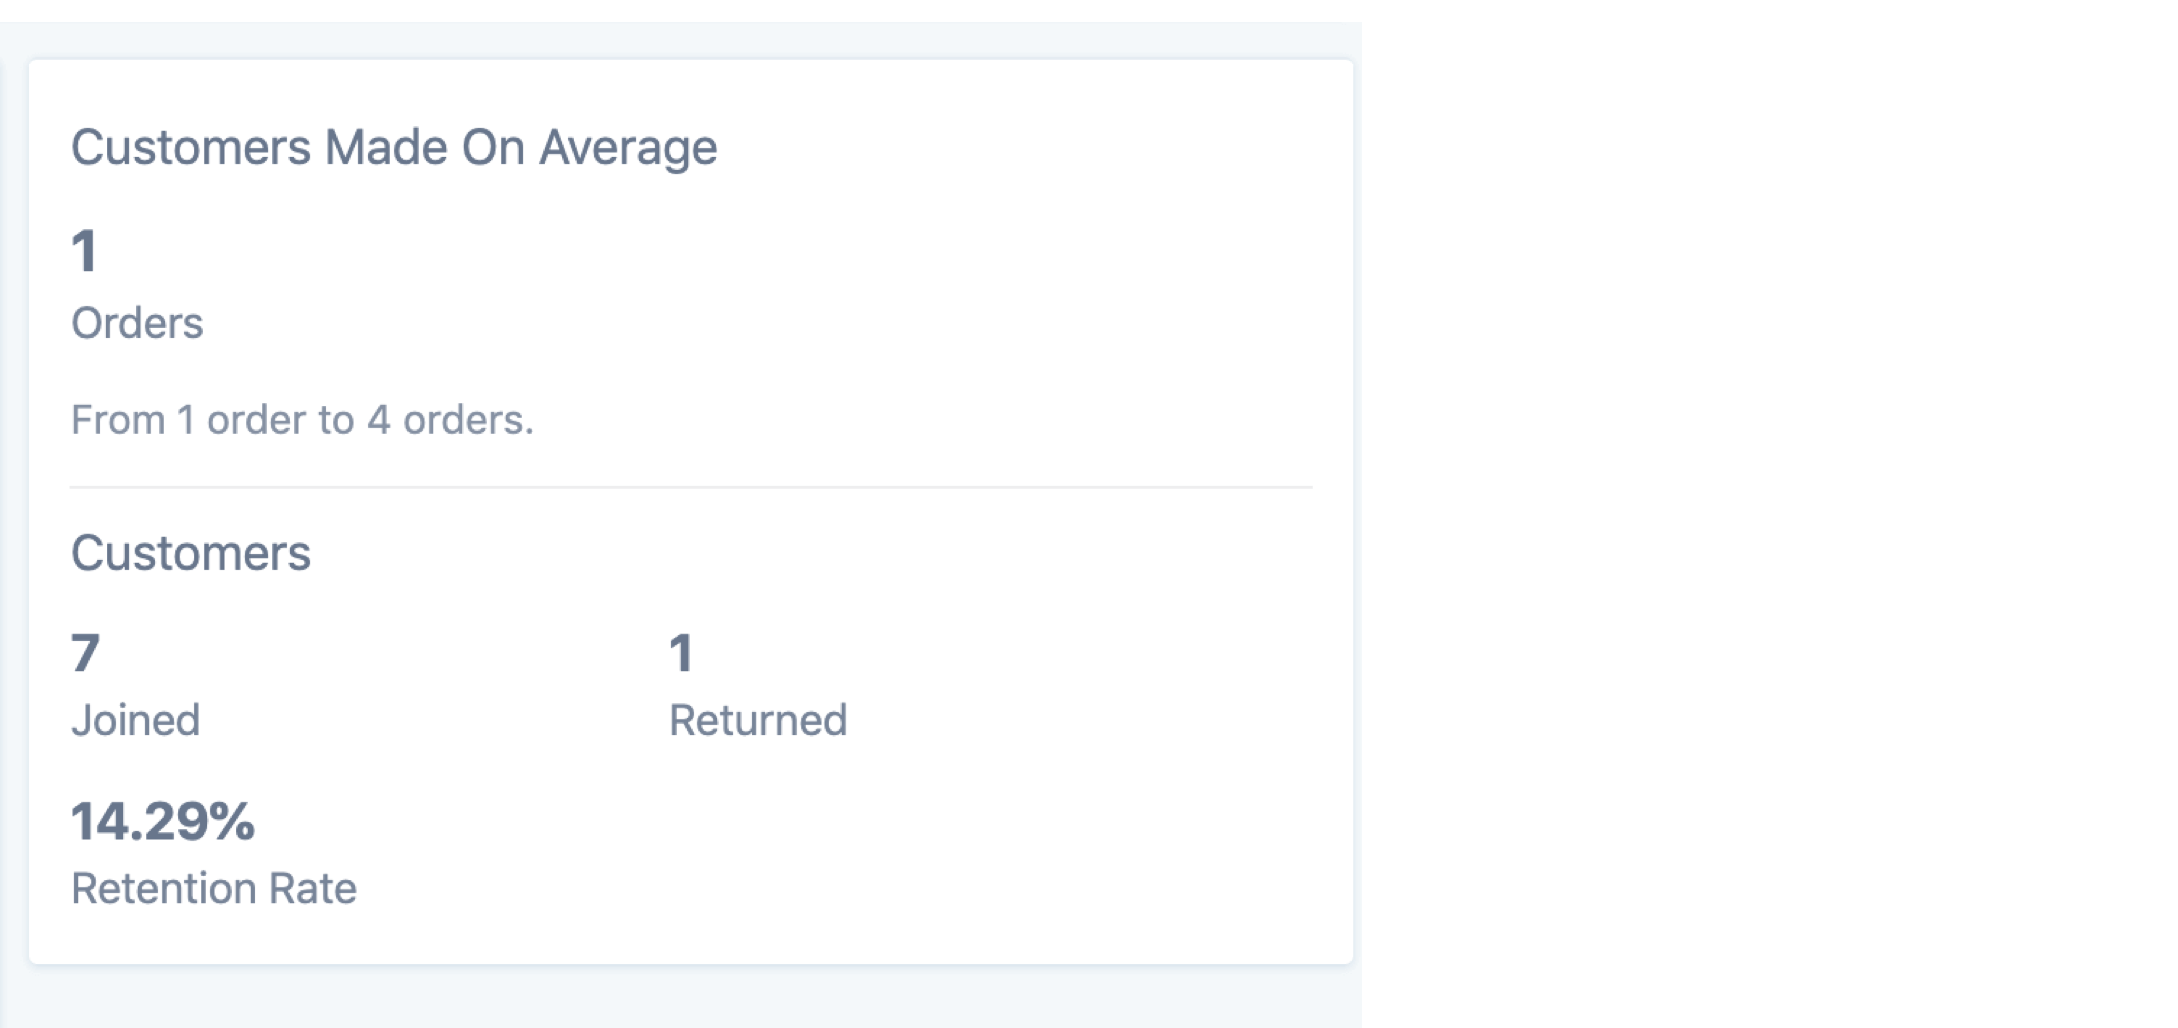
So for example, if over the lifetime of your store you had 7 customers make an order, and out of those 7 customers only 1 made a second purchase, then:
customer retention rate = 1/7 x 100 = 14.29%
Your customer retention rate can be found in your customer retention report:

As in the LTV example, you could set up an Engage automation to help increase your retention rate. You could send coupon codes to customers that have a total order count of 1 but last ordered over several months ago to entice them to make a second purchase.
Monthly recurring revenue (MRR) & annual recurring revenue (ARR)
If you operate a subscription business then understanding and utilising monthly/annual recurring revenue is a prerequisite for success.
MRR tells you how much revenue you should expect to receive every month if there is no change in your revenue base. ARR is just this figure annualised (multiplied by 12). MRR are ARR are calculated using the following equations:

and

So for example, if you have a subscription store with 5 customers, and each customer pays you $100 per month, then:
MRR = 100 + 100 + 100 + 100 + 100 = $500
and
ARR = (100 + 100 + 100 + 100 + 100) x 12 = $6000
If you then increased your marketing budget and 2 new customers signed up, each on your higher $200 plan then:
MRR = 100 + 100 + 100 + 100 + 100 + 200 + 200 = $900
and
ARR = (100 + 100 + 100 + 100 + 100 + 200 + 200) x 12 = $10,800
Your MRR and ARR can be found in the bar at the bottom of your subscriptions:
.png)
And in your subscription report:
.png)
Additionally, you can look at your subscription plans for a more granular breakdown of MRR per subscription product
.png)
Cart abandonment rate & cart placement rate
If you have abandoned cart tracking set up on your site, either through Metorik or another plugin, keeping an eye on your cart abandonment rate and cart placement rate is a good idea.
Your cart abandonment rate looks at out of all the carts created on your store over a period, how many of these were abandoned and not placed:

And your cart placement rate is pretty much the opposite. Out of all the carts created on your store over a period, how many of these were placed and not abandoned:

Mathematically speaking, your abandonment rate + your placement rate should equal 100%.
If you had 9 carts created, 2 abandoned and 9 placed, then:
cart abandonment rate = 2/9 x 100 = 22.2%
cart placement rate = 7/9 x 100 = 77.8%
A successful eCommerce store should have a low abandonment rate and a high placement rate. If you are experiencing the opposite, you need to have a think about what’s causing this? Maybe your checkout process is clunky and slow, causing your customers to close your site out of frustration. Or maybe you are forcing customers to check out by creating an account on your store when they want to just check out as a guest (PS. If you’re using Metorik, guests are automatically grouped and treated just like customers). Or maybe as they are about to purchase, they’re having second thoughts about how much they’re spending.
It’s your job to isolate these causes, but as I mentioned, start by actually looking at the figures. In Metorik these can be found in your cart reports:

Pro Tip: You can use Engage to send abandoned cart recovery emails to try to convert abandoned carts into recovered carts.
Conclusion
The eCommerce metrics we discussed today can help you better understand your data and therefore your customers. If you can keep an eye on these key metrics, and make tweaks to your products, services, and branding based off them, you can significantly improve your customer experience and increase sales.
If you have any other eCommerce metrics you swear by, let us know so we can include them in part 2!

-1549438730.jpg)
