-1549438730.jpg)
When you're first starting your WooCommerce store, it's almost a no-brainer to add in Google Analytics tracking. It only takes a moment, there are 100's of WordPress plugins to do it so you don't need to touch any code, and best of all, Google Analytics is free. This is a good guide for getting the view-tracking part setup.
But while it's cool to see how many people are looking at your store, what products get the most views, or where your users are coming from, it's only part of the picture. What is crucial to be able to see is your store's conversion rate; of all the people that come to your store, what % actually end up buying something?
Sure, you can do the math yourself. Take the number of visitors to your site for a period, the number of orders you had in that period and then divide orders by visitors. But, who has time for that?
The problem
While there are plugins you can download or purchase for WooCommerce that help you record sales in Google Analytics, allowing you to see conversion rate and other data straight from Google Analytics, they aren't really ideal solutions. Why?
It's another thing to manage and keep up to date.
It takes time to setup.
It's not accurate, as it won't reflect failed/cancelled orders, or certain sales you want to exclude (like those that were worth $0, for example).
It only gives you conversion rates from the day you set it up.
So, knowing all this, we spent quite some time thinking about how Metorik could solve it.
The solution
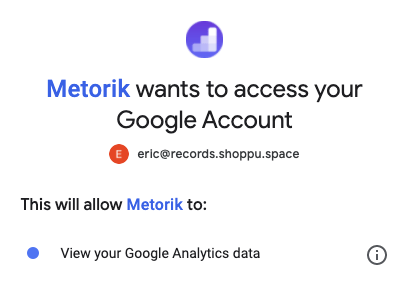
After getting Metorik setup for your store, you can quickly and easily link your Google Analytics account; this lets Metorik know where it should be getting the data from:
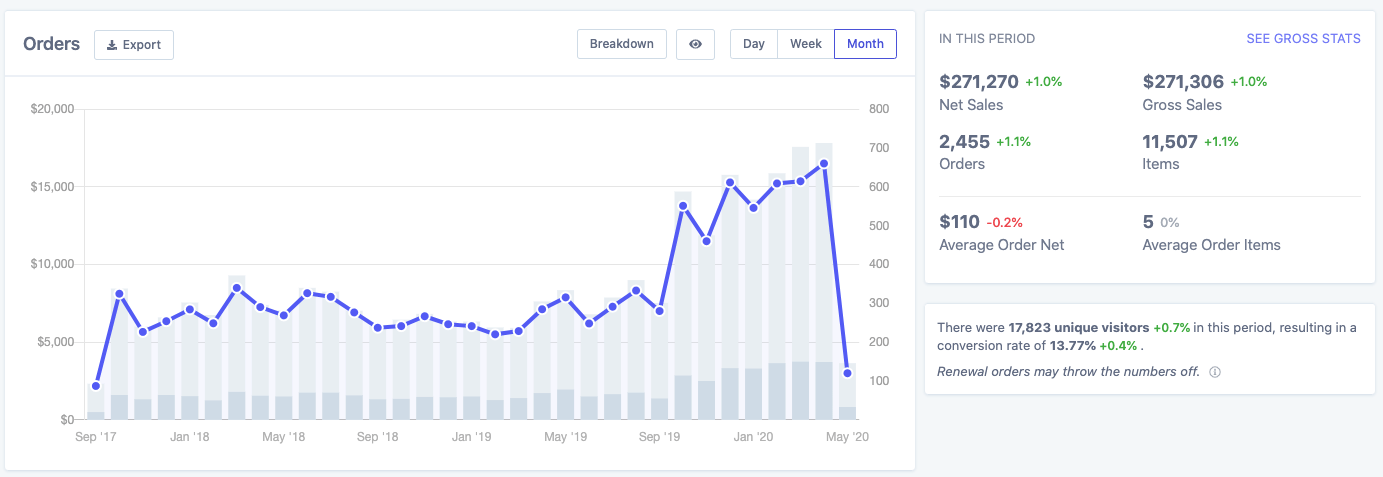
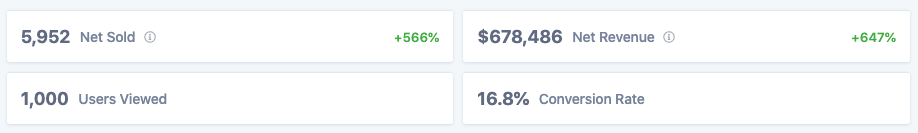
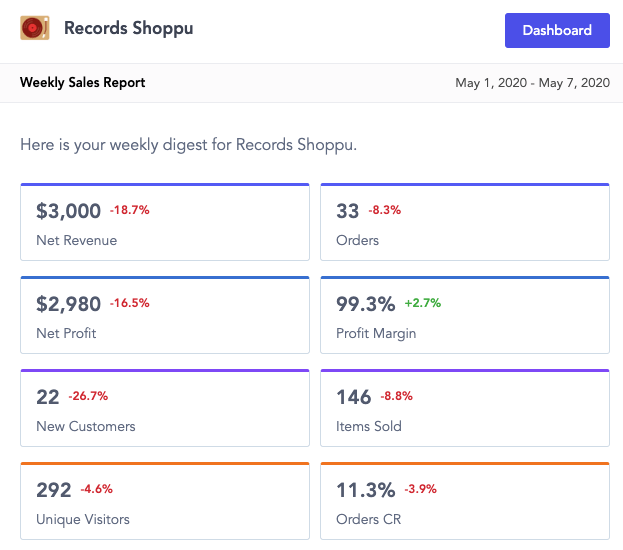
Once it's connected, a whole bunch of useful metrics start appearing around Metorik, combining your unique visitors recorded in Google Analytics with your WooCommerce sales data, determining your conversion rate and its growth/change over time. So for example, you will be greated with these new cards from the dashboard:

Now keep in mind — this is right after setting up the integration (and there's no extra code or anything that's been added to the store), but yet there's conversion rate data for the entire history of the store. You're able to see conversion rate data for as long as you've had the simple Google Analytics tracking code on your store tracking views (that's all it takes).
And if you head to the orders reports, you will get a better a more detailed breakdown of how the conversion rate was derived:
Granular WooCommerce conversion rates
But it doesn't really stop there. Yes, a global conversion rate is great, but if you sell numerous products, across different platforms, you are going to want more granular conversion rates.
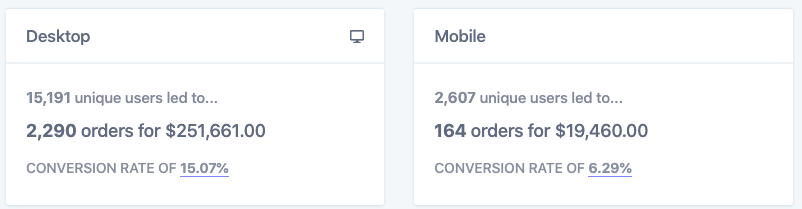
Conversion rate by device
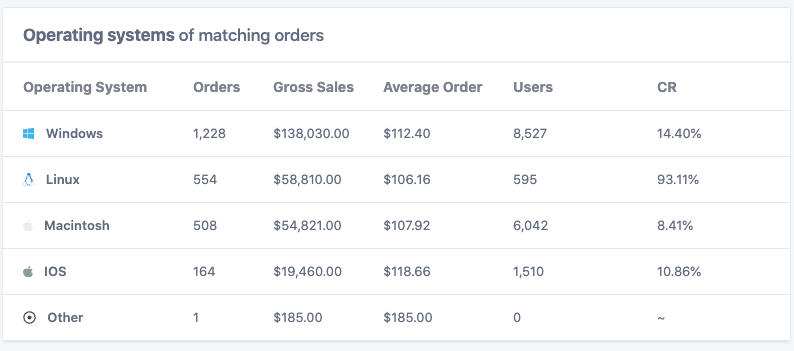
The devices report gives you a breakdown of your orders, gross sales and average order value by type of device, operating system, and broswer. But once you connect your Google Analytics account to Metorik, it also gives a conversion rate per type of device:
Operating system:
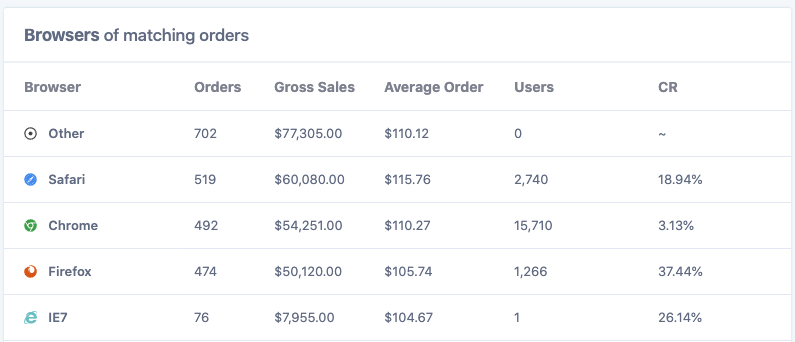
And browser:
These conversion rates can be a gamechanger for a lot of eCommerce stores. You might have been happy with the topline-conversion rate of 13.77% that we saw before. However, the devices report shows that on Desktop we have a conversion rate of 15.07% which is great, but only 6.29% on mobile? Why is this the case?
It's possible to conceive that users on a desktop have a higher intent to purchase than someone casually browsing on the phone. However, another possible reason is that your mobile site UX isn't smooth and user friendly enough. In either case, seeing this mobile conversion rate can give you a better idea as to where to allocate your resources. In this case, we should be looking at optimizing mobile, rather than re-designing our desktop site.
Individual product conversion rates
If you head to any of your individual product pages, you will also see an individual conversion rate. This is crucial to be able to see which products are converting well, and which need to be improved.
Conversion rates in your inbox (or Slack)
Metorik also has customizable sales reports built right in. So you can create a report that is either sent to your email or Slack, and completely customize which metrics it contains.
Once you have Google Analytics connected, you can include the conversion rate for the day/week/month directly in the email:
TL;DR
Metorik's integration with Google Analytics allows you to see your WooCommerce conversion rate with ease. What's even better is that you can see conversion rates across all devices, browsers, operating systems and products. This will allow you to better understand how 'efficient' your business is, something which isn't as easy to gauge from standard figures like revenue and order count.