Since Metorik launched at the end of 2016, there's be one feature requested more than any other. One feature that almost every customer would ask about. And one feature that got more votes on the Metorik roadmap in a day than most get in months.
Cost of goods integration
And I promise, I've been listening! But as any one who runs a business knows - and many of you reading this do run very successful businesses - prioritisation is key. So when 2018 began, I sat down to figure out what my priorities were for early 2018, and even wrote a blog post about it.
I came to the conclusion that integrating with the official Cost of Goods Sold extension was a priority and spent the next 3 weeks doing just that. Those 3 weeks have passed and today, the integration went live for all existing and new Metorik stores. 🎉
As long as you have the plugin installed and set up, Metorik will automatically integrate and let you access all the features I'm about to talk about.
The profit report
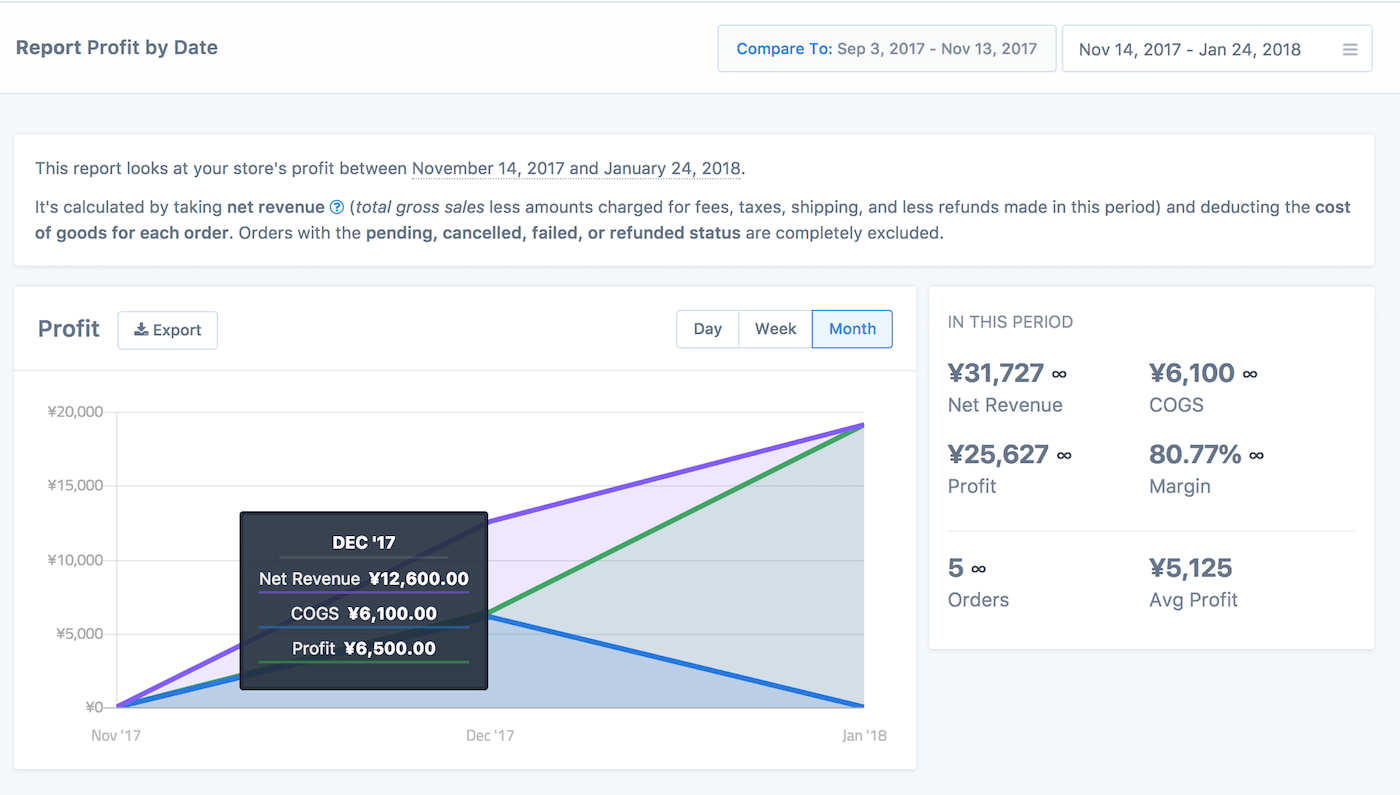
The first part worth mentioning is the new profit report. It gives you a bird's eye view of your entire store's profit, based on your net revenue and COGS. It looks a little bit like this:

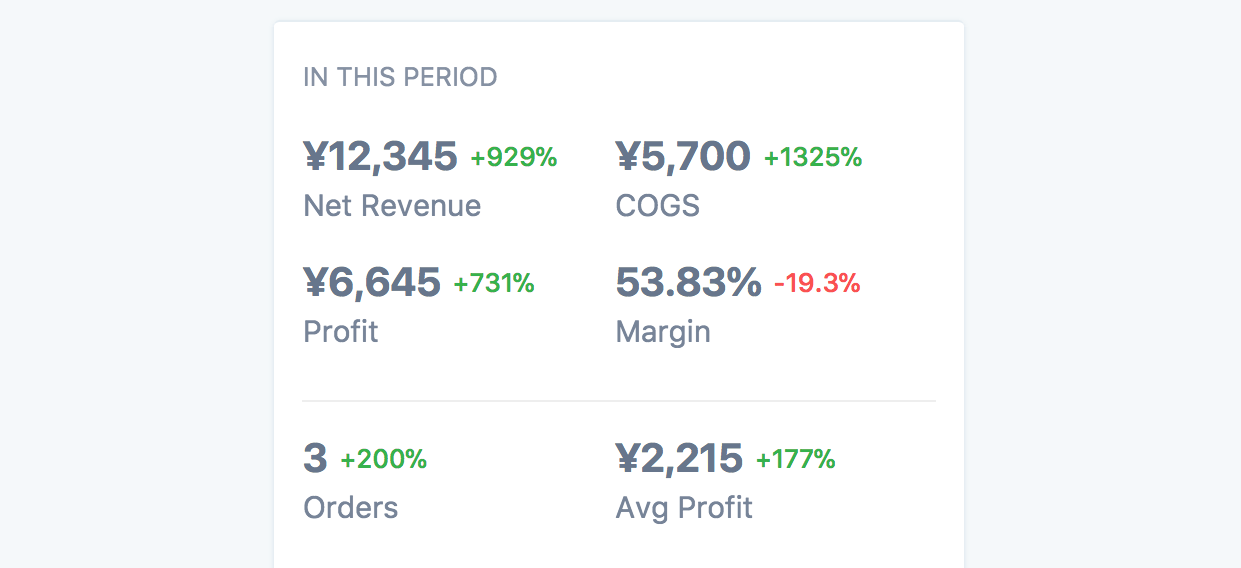
You can use the chart to see activity on a daily/weekly/monthly basis and find trends, while the totals on the right will help you see how you're doing overall. The interesting numbers there are the profit (based on your total COGS) and the overall profit margin. Another interesting KPI worth looking at is the average profit per order. You can also compare these stats across time to see growth:

Below the chart, you can access a profit breakdown table. It summaries the chart's data in an easy to read table format, with the ability to sort and export instantly.

Product, variation, and category profit reports
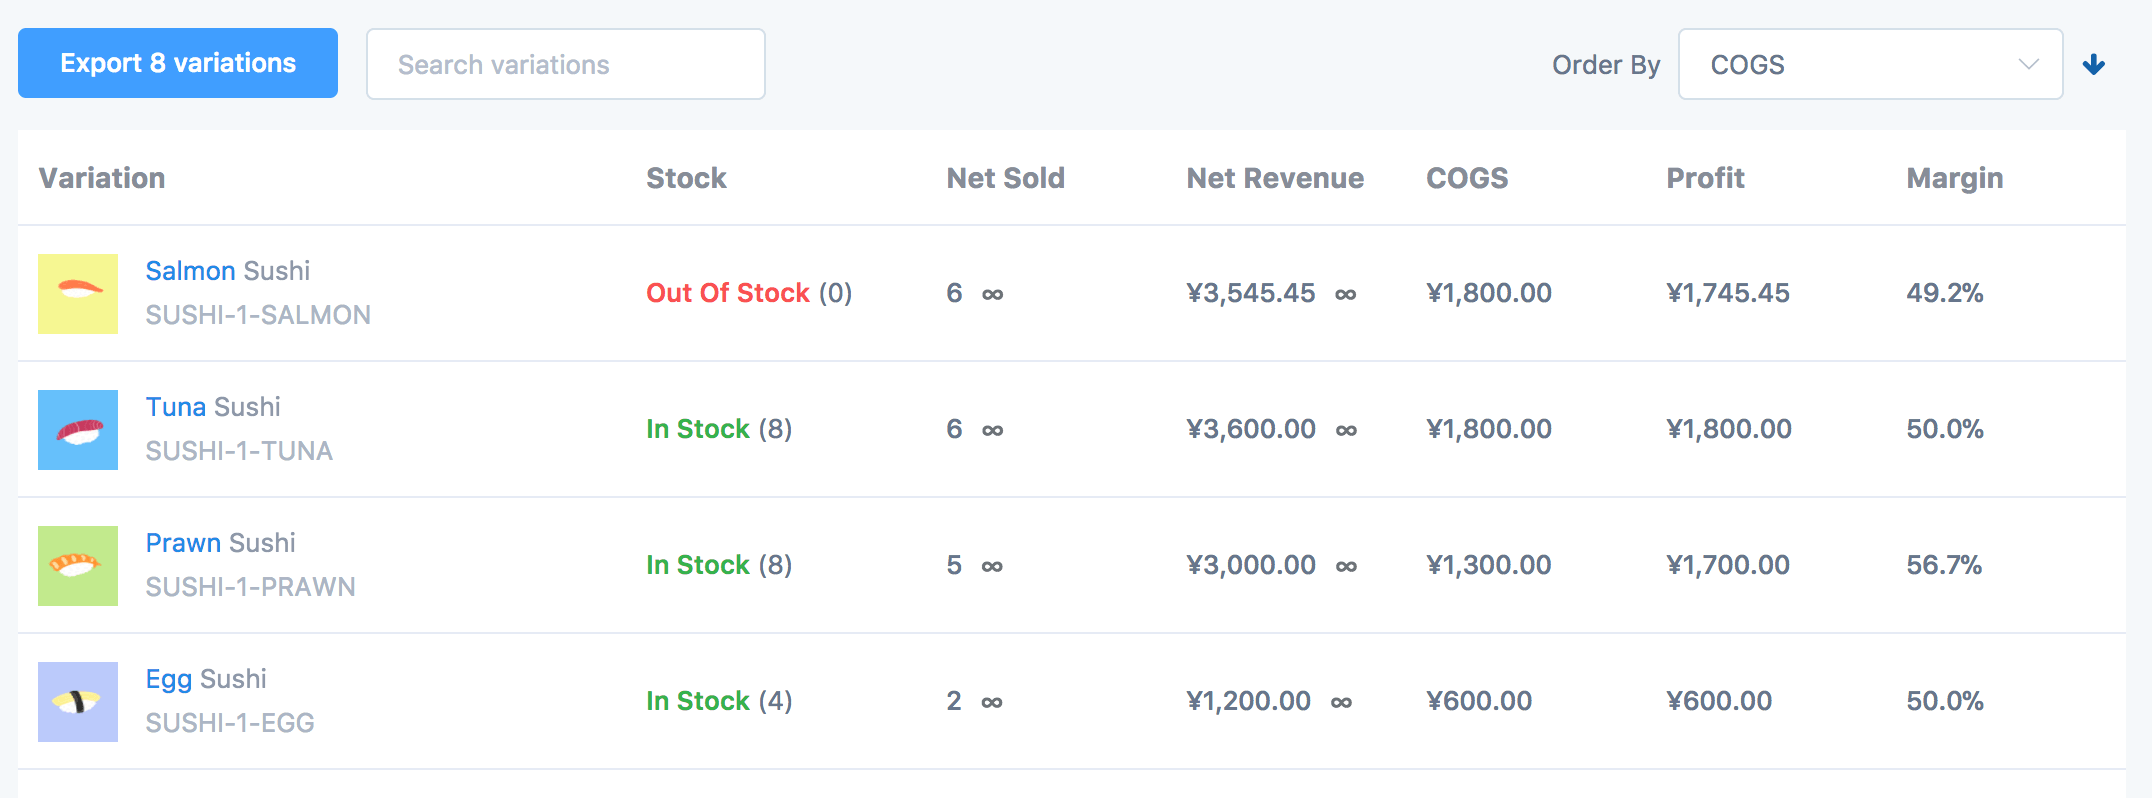
This is where things get pretty interesting. On the product, variation, and category pages, a few new columns are now available: COGS, Profit, and Margin. Here Metorik shows you the cogs/profit/margin for each product/variation/category, and lets you sort and export by the COGS and Profit with ease.

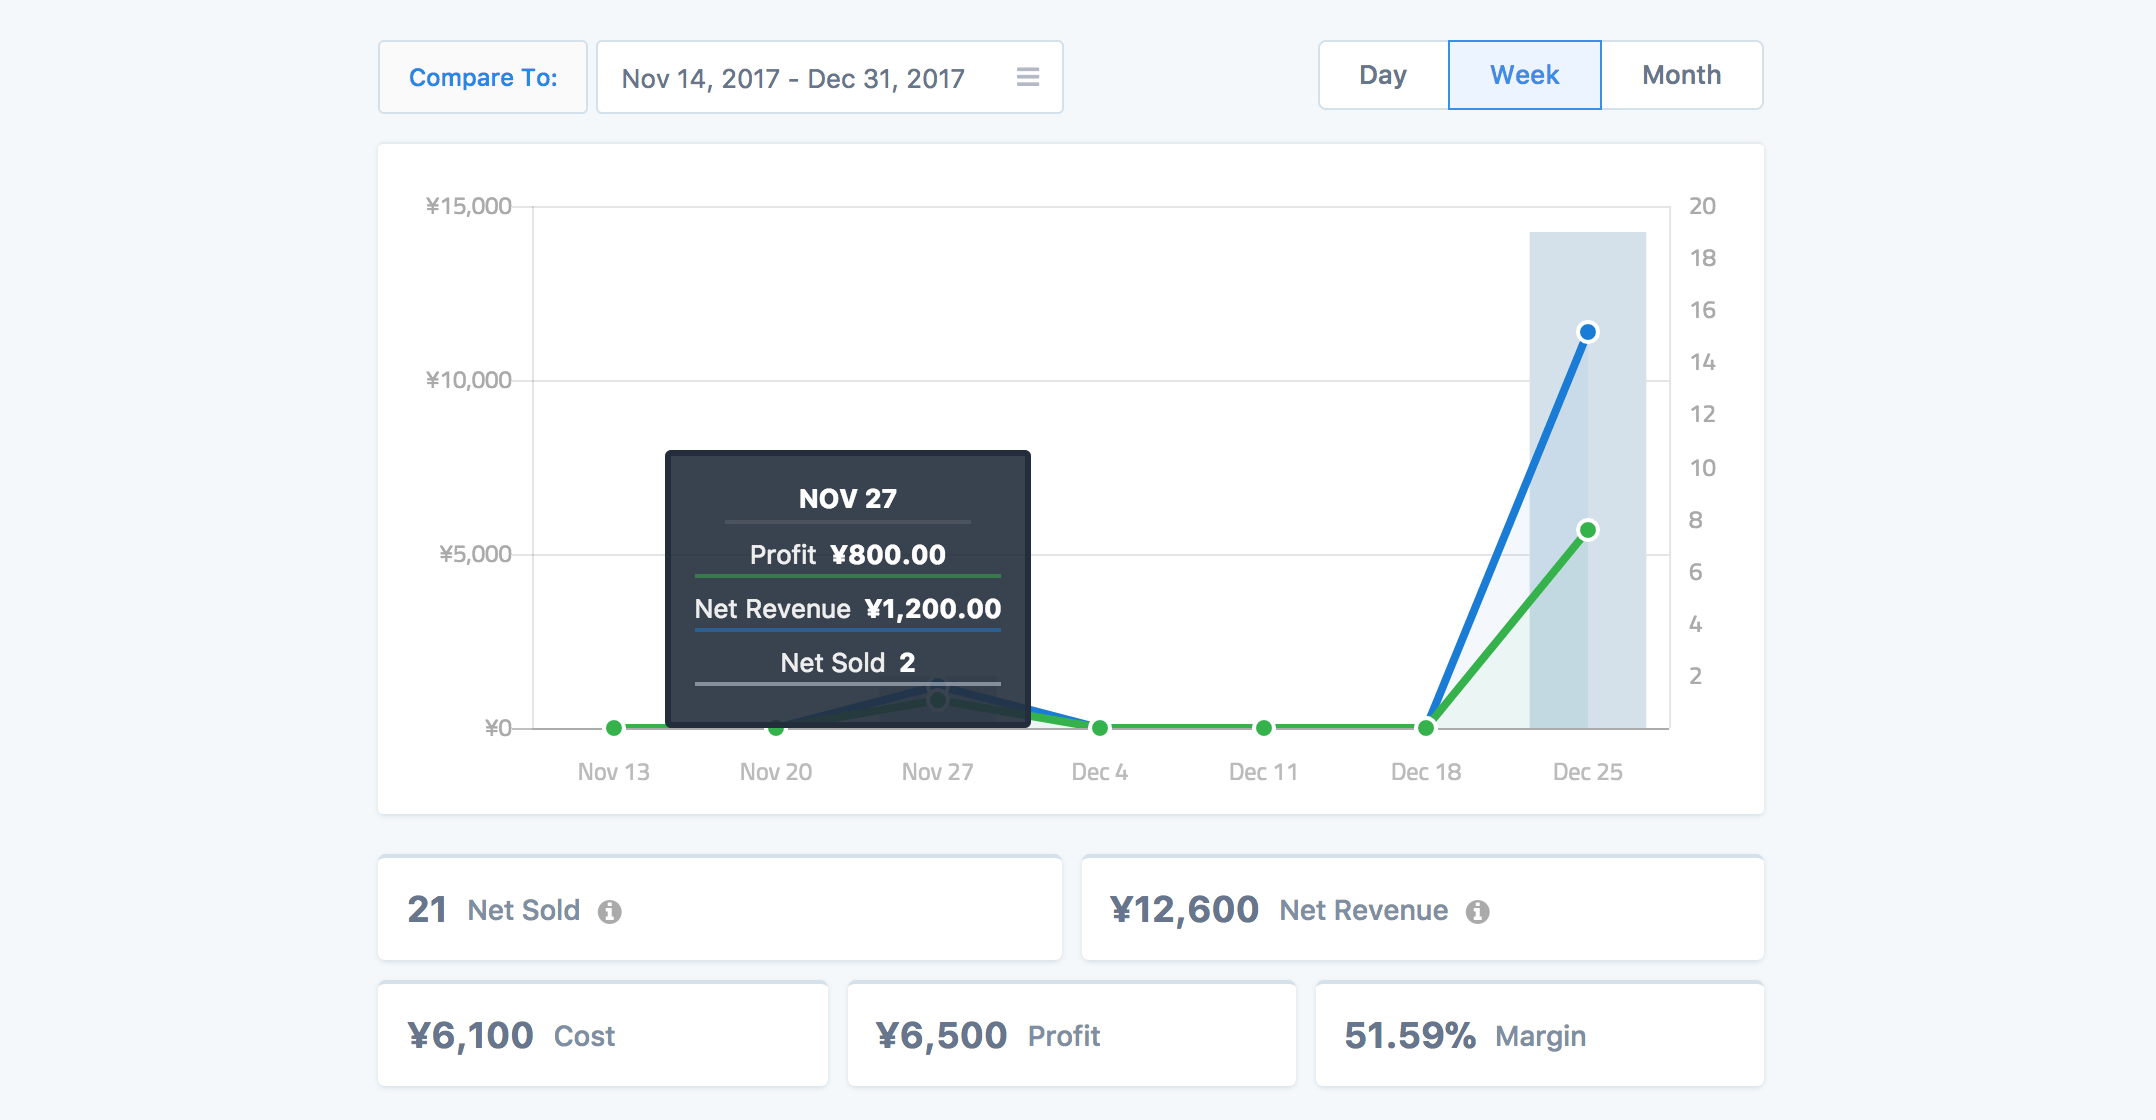
On its own, this is a pretty powerful feature, but it gets even better. If you click through to view the sales stats for a single product, variation, or category, you can see the COGS, Profit, and Margin just for it (over time):

As you can tell from reading this blog post, I'm pretty excited about this new addition to Metorik and looking forward to hearing what you all think of it.
There's more to come in the near future, like seeing profit by country/city/customer role/currency/etc., stock valuation viewing & exporting, and more.
If you're interested in the details regarding this integration, check out the documentation here, or better yet, give Metorik a try right now.


