Choosing the products
This report is designed to allow you to compare product performance over time for a few products and variations.
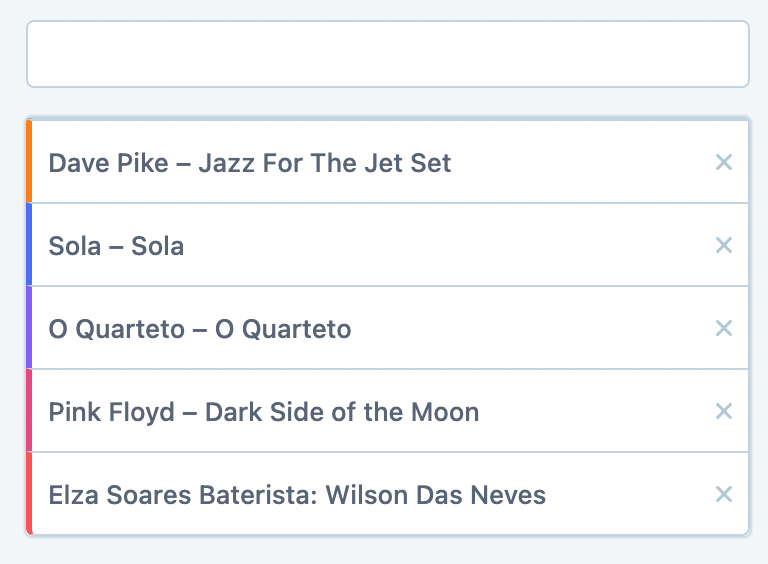
You can simply begin typing the product name or the product id of the product into the search box and then select them one by one:

You can add as many products and/or variations as you'd like:
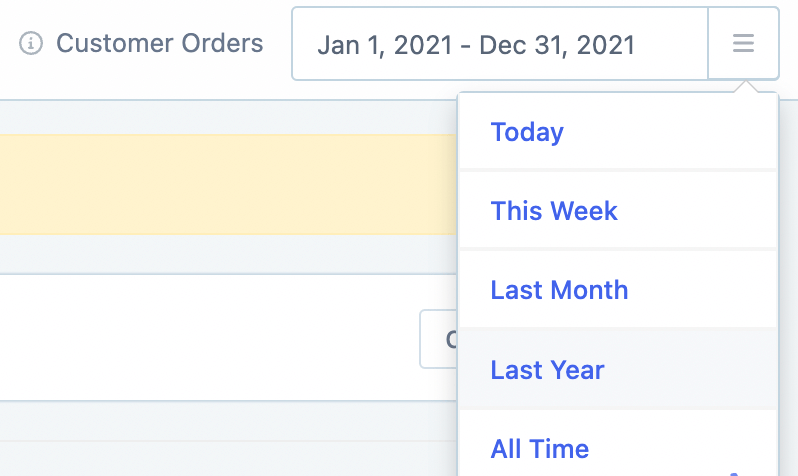
Then select the date range that you would like to look at using the date picker:
Graph options
You will then see the sales of these products both as a graph and table:
.png)
Hovering over any data point on the graph will show the specific sales for that period for the products.
Within the graph options, you can switch between Net Sold and Net Revenue values. You can also view the data by Day/Week/Month:

You can also export this data to a CSV file by clicking on the Export button.
