Overview
To begin looking at the revenue report, the initial step is to specify the date range that you wish to examine, such as the current year or a specific period of time.
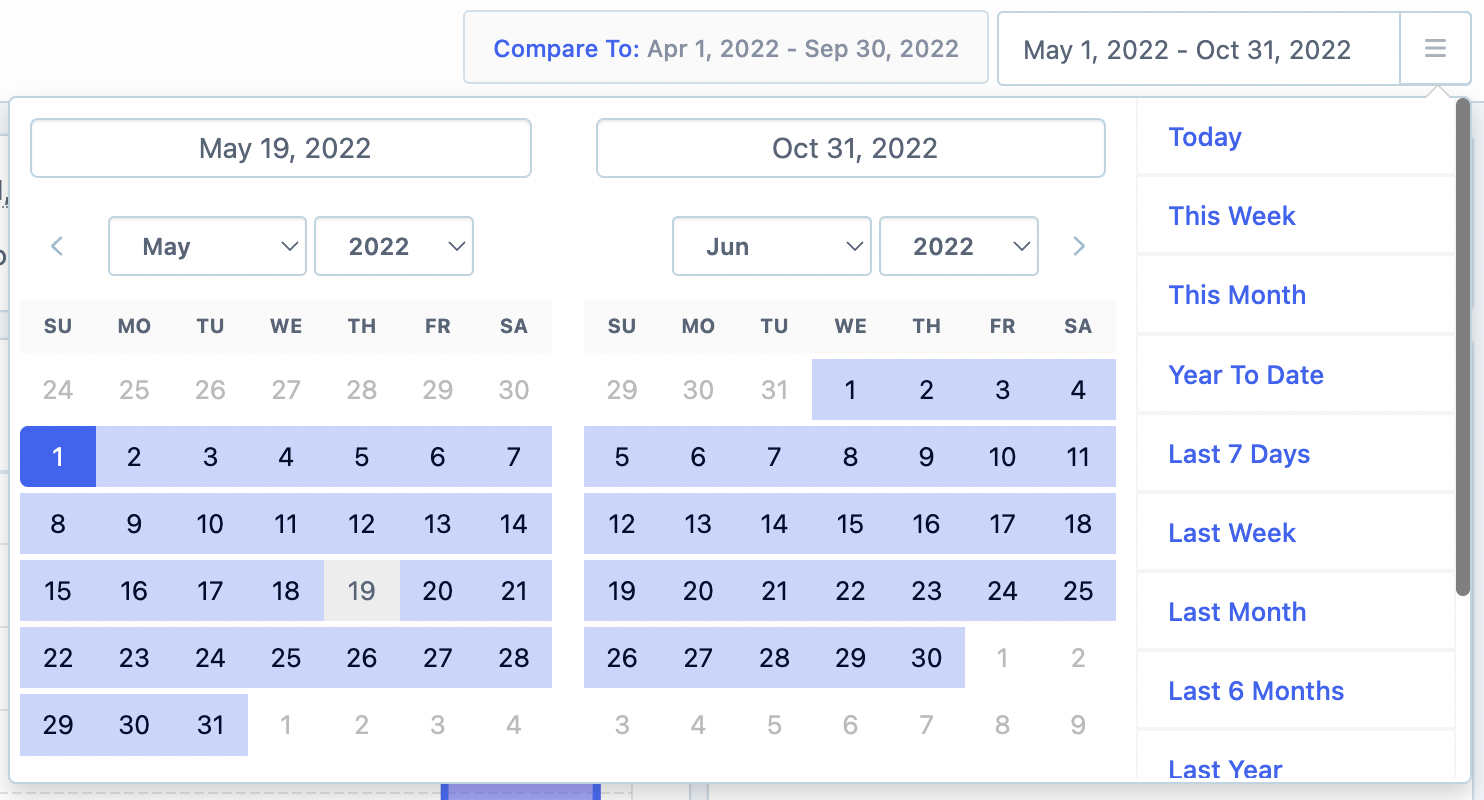
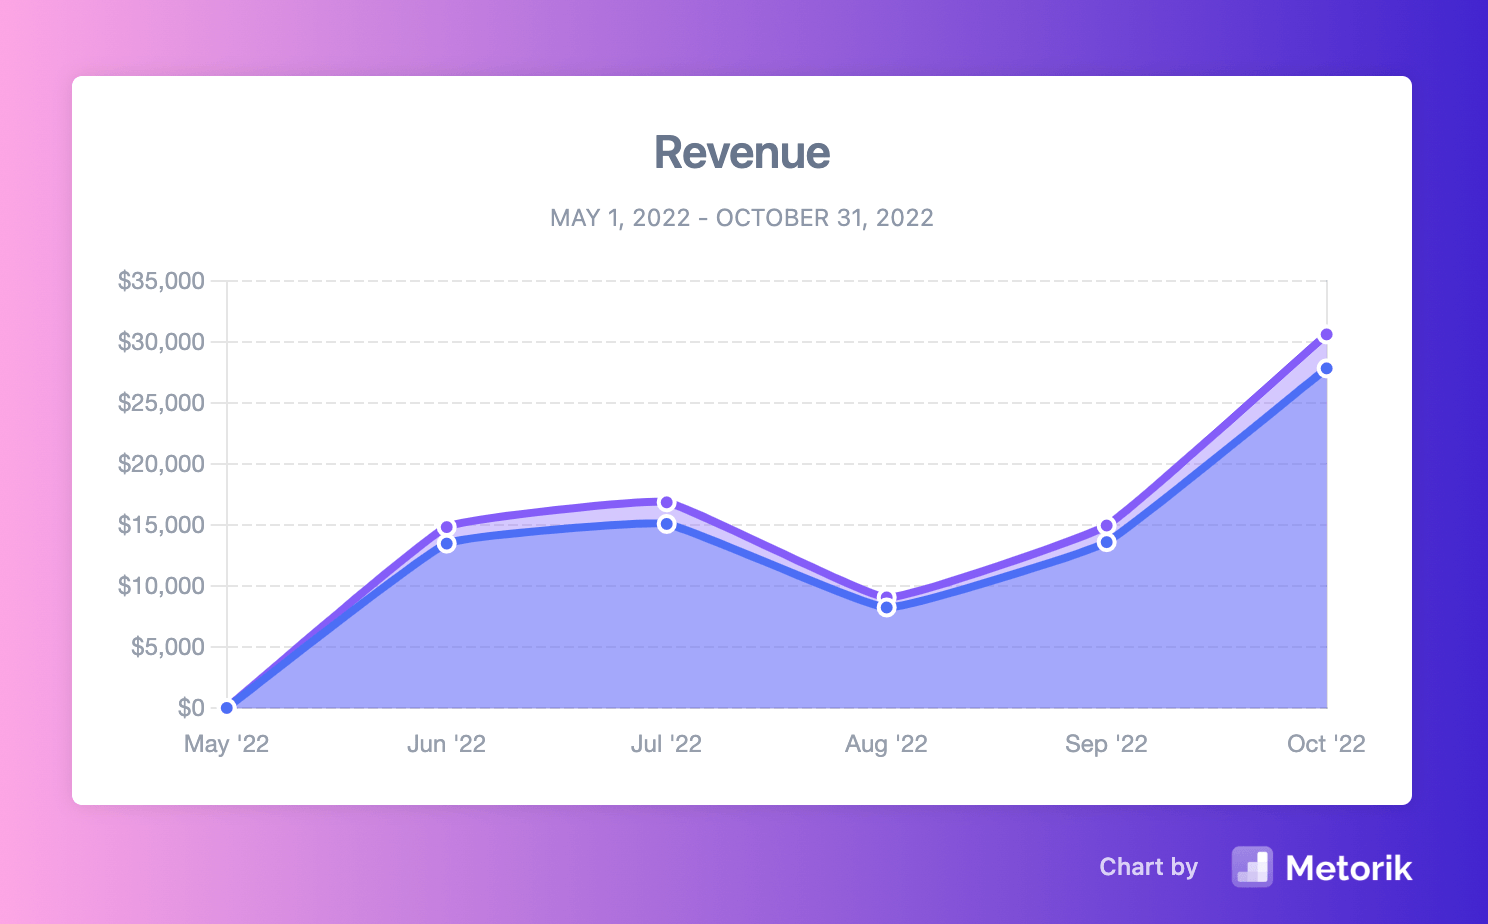
Upon doing so, you will be able to see the revenue for this specific date range.
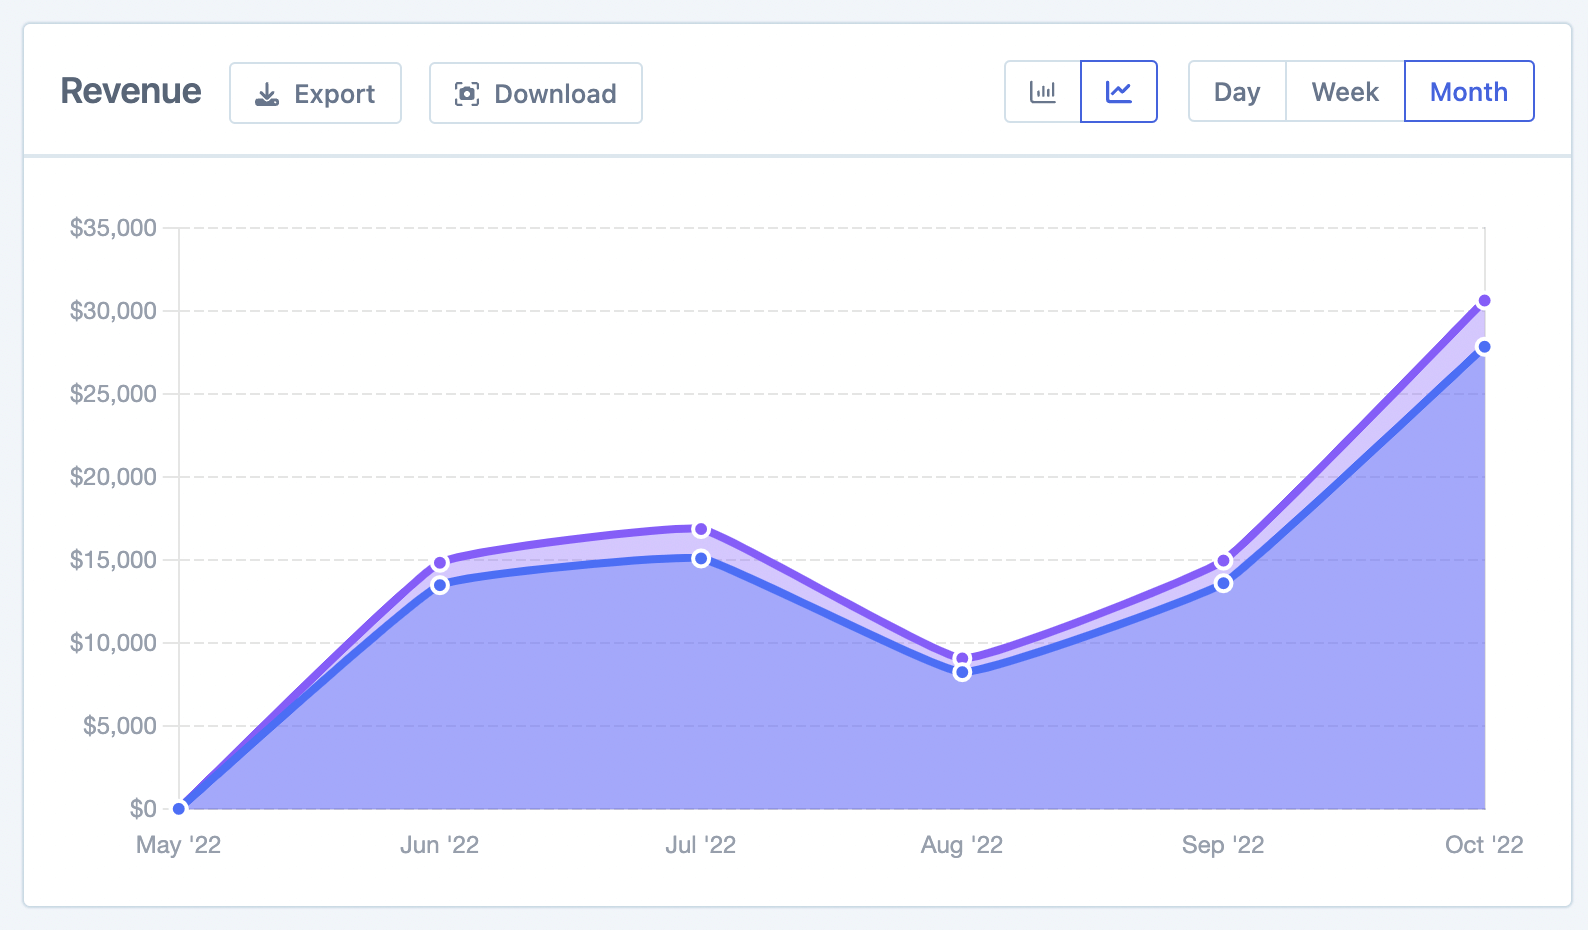
You have the choice to display the graph by day, week, or month and it is possible to switch between a bar graph and a line graph for the display format.
Additionally, the corresponding overall total stats for that period can be seen.
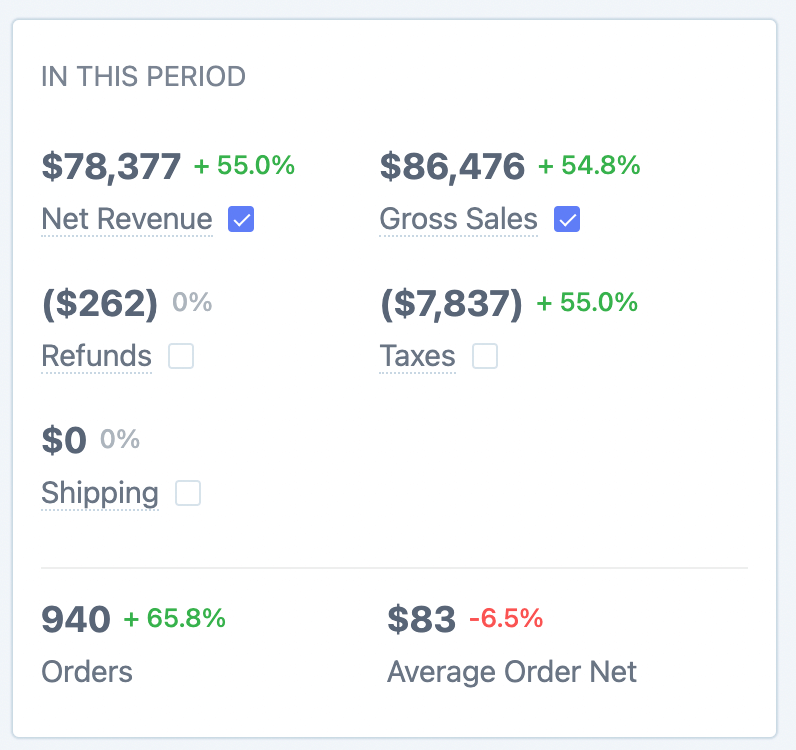
(if you select the checkbox next to each statistic, it will be included in the graph as well)
You will also notice that next to each stat is a % value which if you hover over gives a "Previously" value.
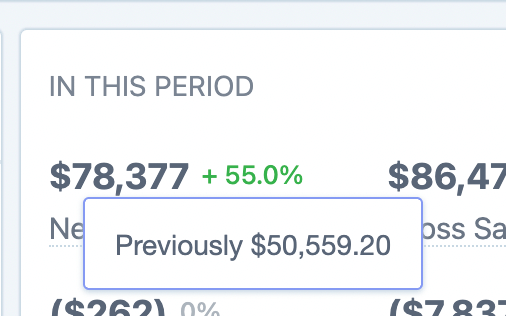
This feature corresponds to the "Compare period" functionality, which allows you to contrast data with other time periods, aiding in the identification of metric growth which you can read about in full in our guide: Understanding Comparison Periods in Metorik.
The refunds value that is shown is for the refunds made in this period, this is slightly different from how the Orders Report in Metorik functions. There is a full explanation of this with examples in our help doc: Net Revenue and the Orders Report.
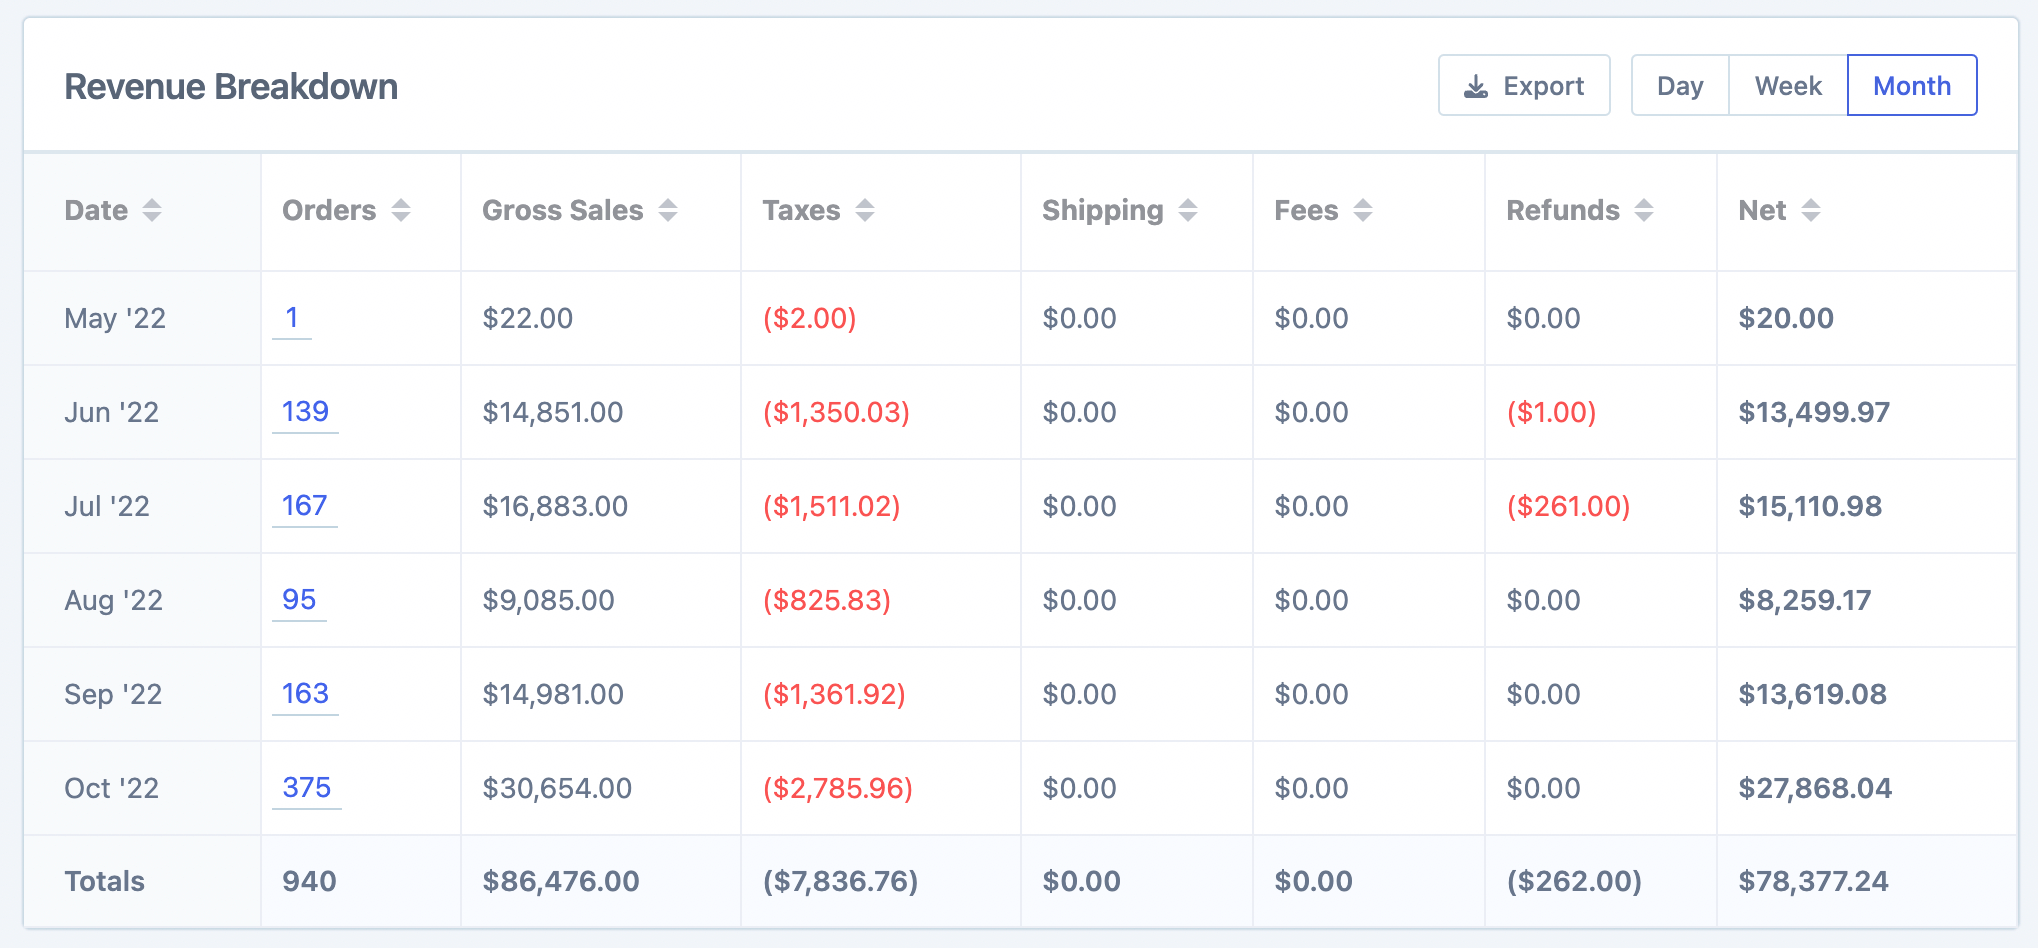
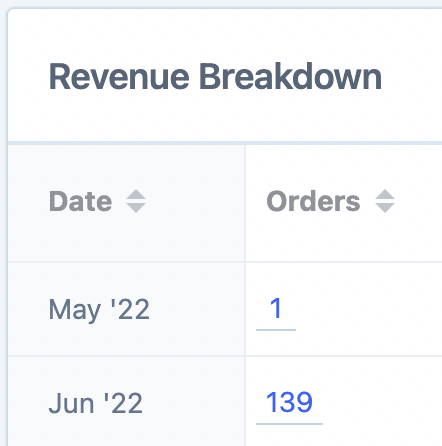
Breakdown
In this section, a comprehensive breakdown of various revenue statistics are available in table form. Similarly, this information can be displayed by day, week, or month like the graph.
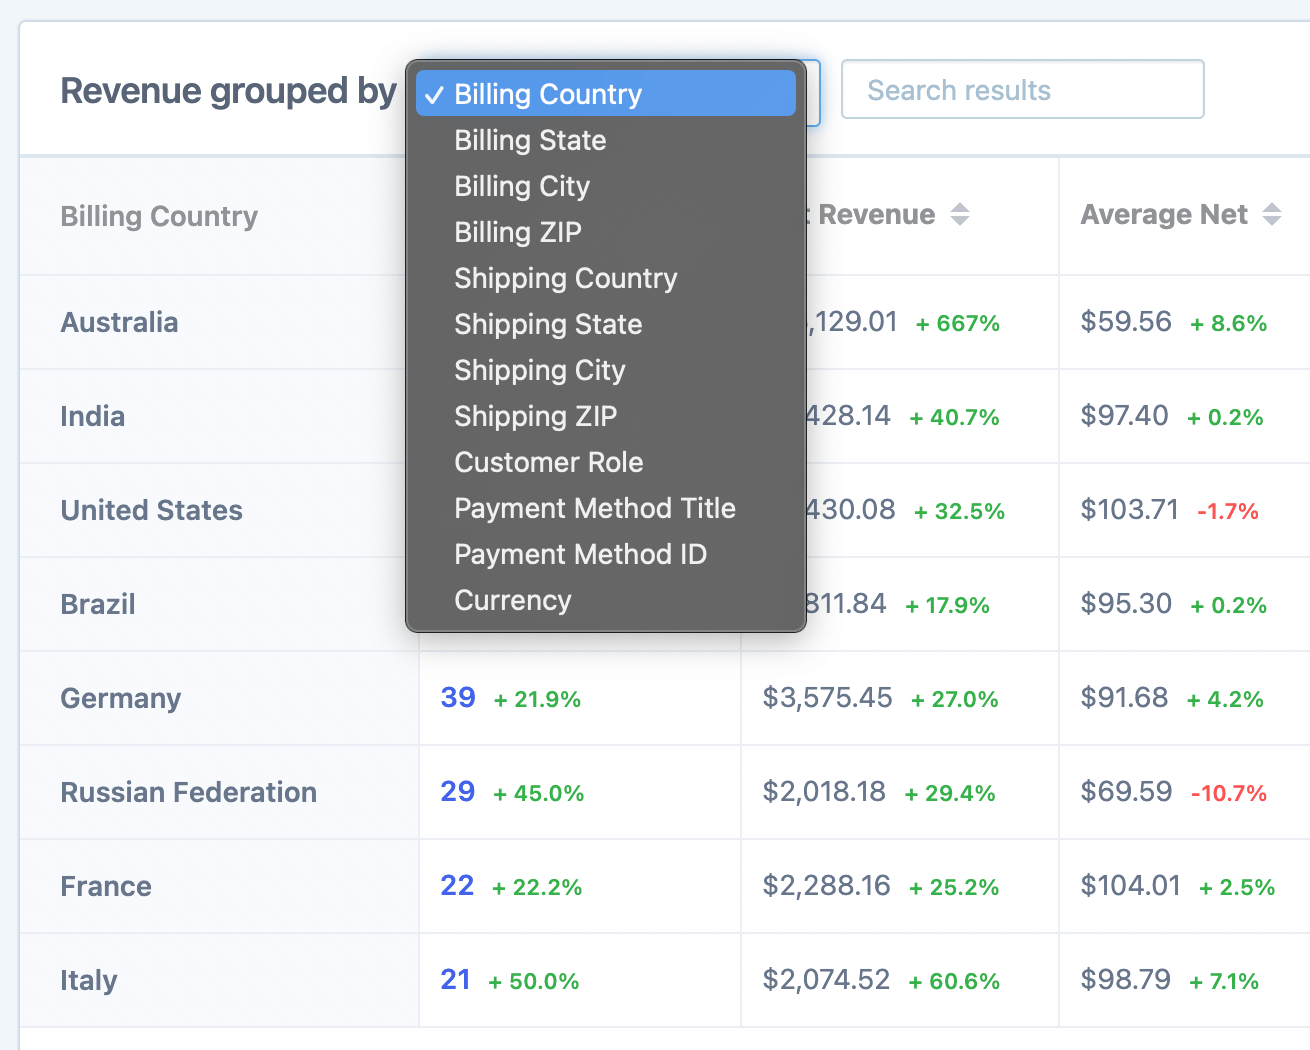
Grouped by
You have the ability to group this data based on various criteria, including billing country, customer role, payment method, etc. This enables you to drill down into the precise revenue statistics you are looking for.
Tax
Furthermore, there is an option to view the revenue grouped by the various tax rate codes or IDs.
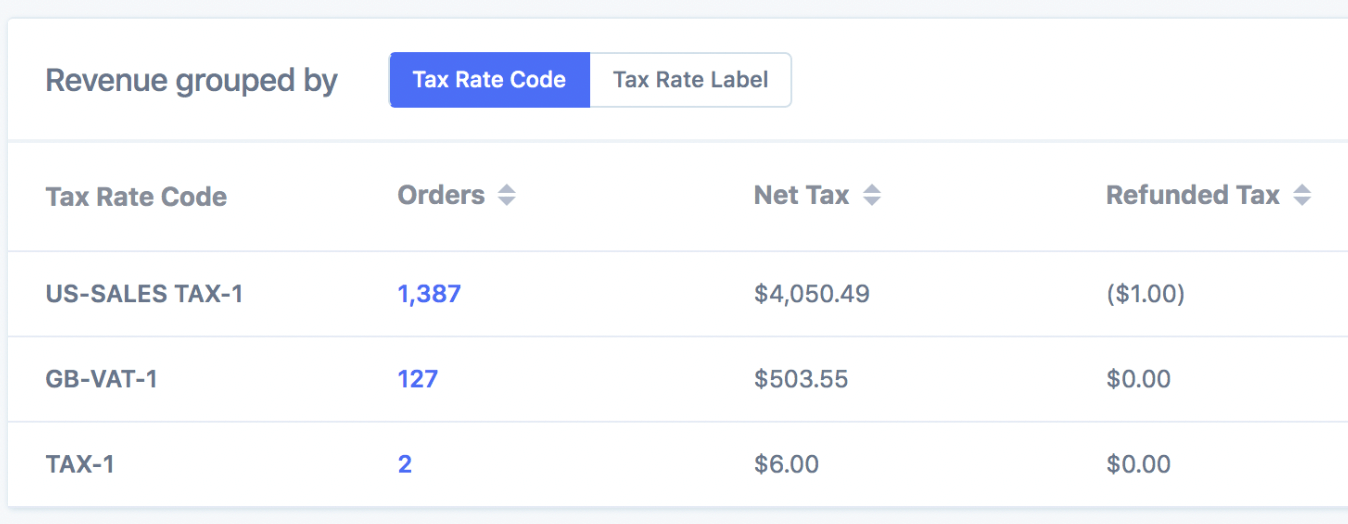
A complete explanation of how this tax section works can be found here: Tax Reporting in Metorik.
View orders
If you want to review the specific orders that make up the report, you can accomplish this by selecting the "View orders in this report" button.
Additionally, in the report breakdown section, you can click on the orders from that specific period.
Once you click on the button/orders, you will be redirected to the Orders page, with any date filters in place, enabling you to view all the orders that contribute to those figures.
Exporting
For each of the different sections in the report, you will see an export button.
By selecting this option, you can download a CSV file containing all the data related to that section, which can be utilized for external analysis.
Also, within the graph area there is a download button that allows you to save the chart as an image (more information on that here: Charting eCommerce Data in Metorik.
Segmenting
The Segmenting Tool is one of the most robust functions in Metorik, and it can be used with all the primary reports, including the revenue report.
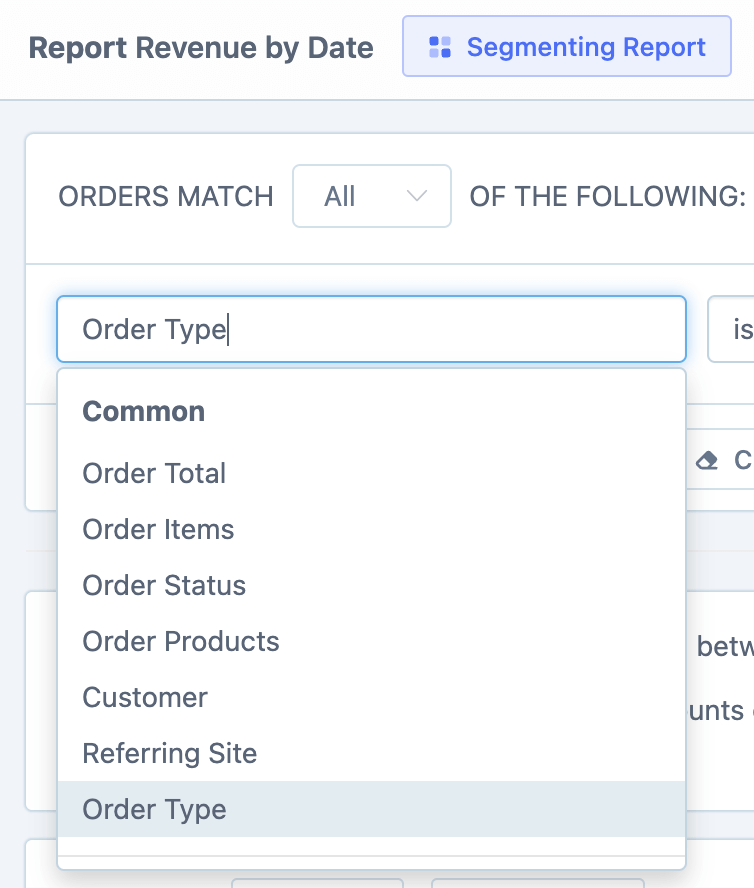
Using one or multiple of the hundreds of different filters enables you to set the data to your exact specifications, thus offering a high degree of granularity and allowing you to view revenue statistics tailored to your specific needs.
